
Figure 3.
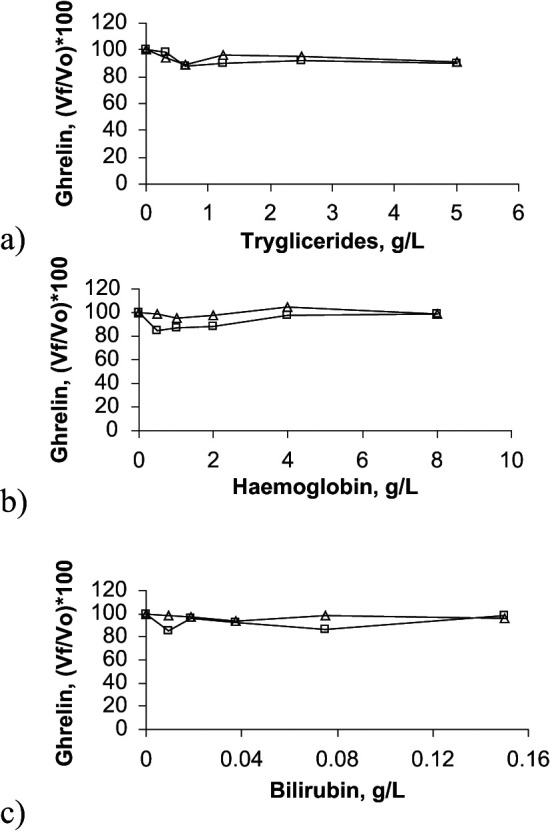
Interferograms corresponding to the effect of triglycerides (A), haemoglobin (B) and bilirubin (C) concentrations on ghrelin determination in two feline serum pools. In these graphs, results obtained with the two pools are presented with open boxes and with open triangles, respectively. X-axes show increasing concentrations of haemoglobin, triglycerides or bilirubin, whilst Y-axes show percentage of change in ghrelin [(Vƒ/ V0)×100]. V = final value; V0 = original value