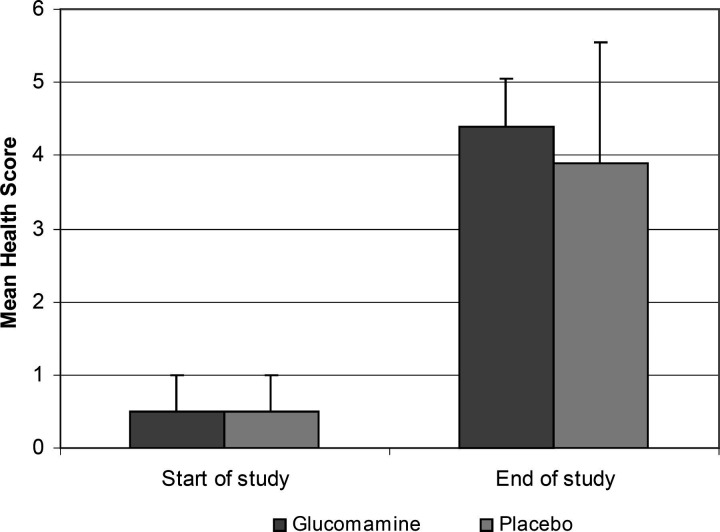
Figure 1.
The figure shows a graph of the mean health scores at the start and the end of the study. The owner's were asked grade the severity of their cat's signs using the scale from 0 (very severe signs of cystitis) to 5 (normal cat). The error bars show the standard deviation. There is no statistical difference between the groups.

