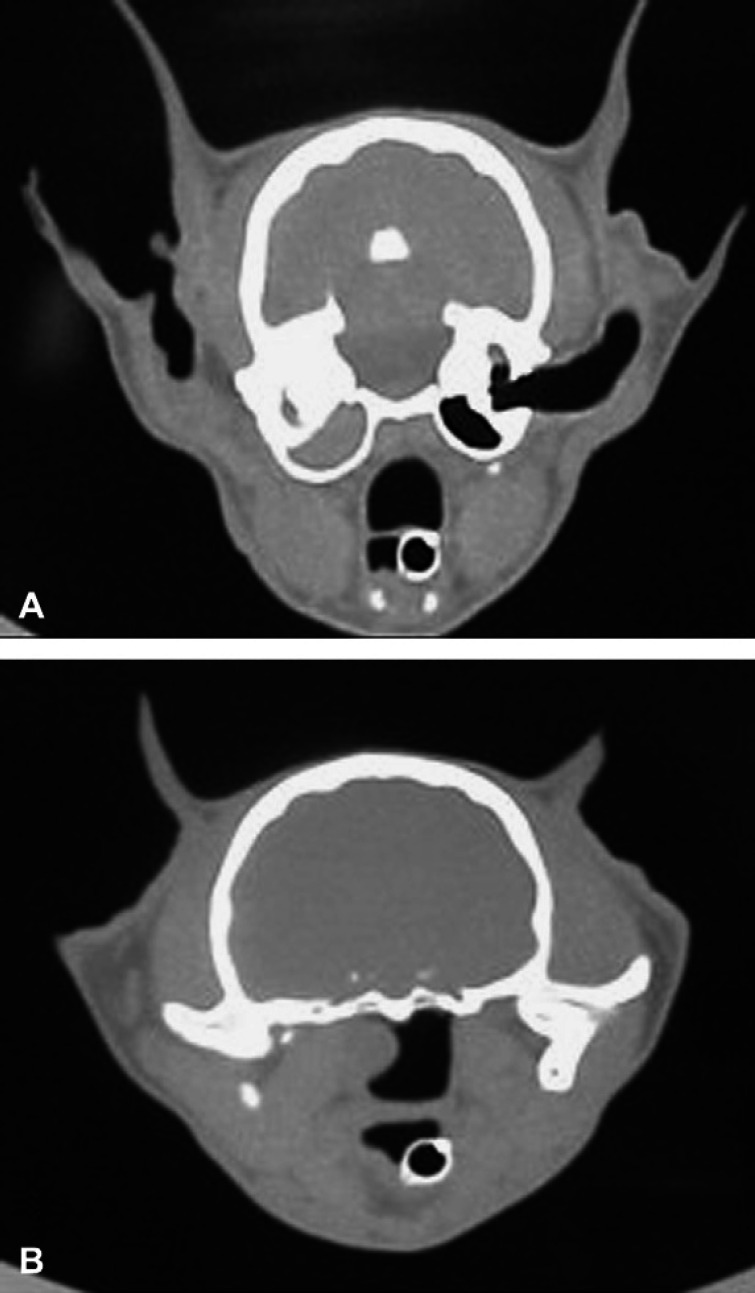
Fig 1.
(A) Transverse CT image at the level of the tympanic bulla demonstrating soft tissue density within the left bulla and extending into the horizontal ear canal. (B) Transverse CT image at the level of the nasopharynx demonstrating a soft tissue intensity mass protruding into the left nasopharyngeal area.

