
Extended Data Fig. 6 |. Identification of ferrosome-associated proteins using liquid chromatography mass spectrometry (LC-MS).
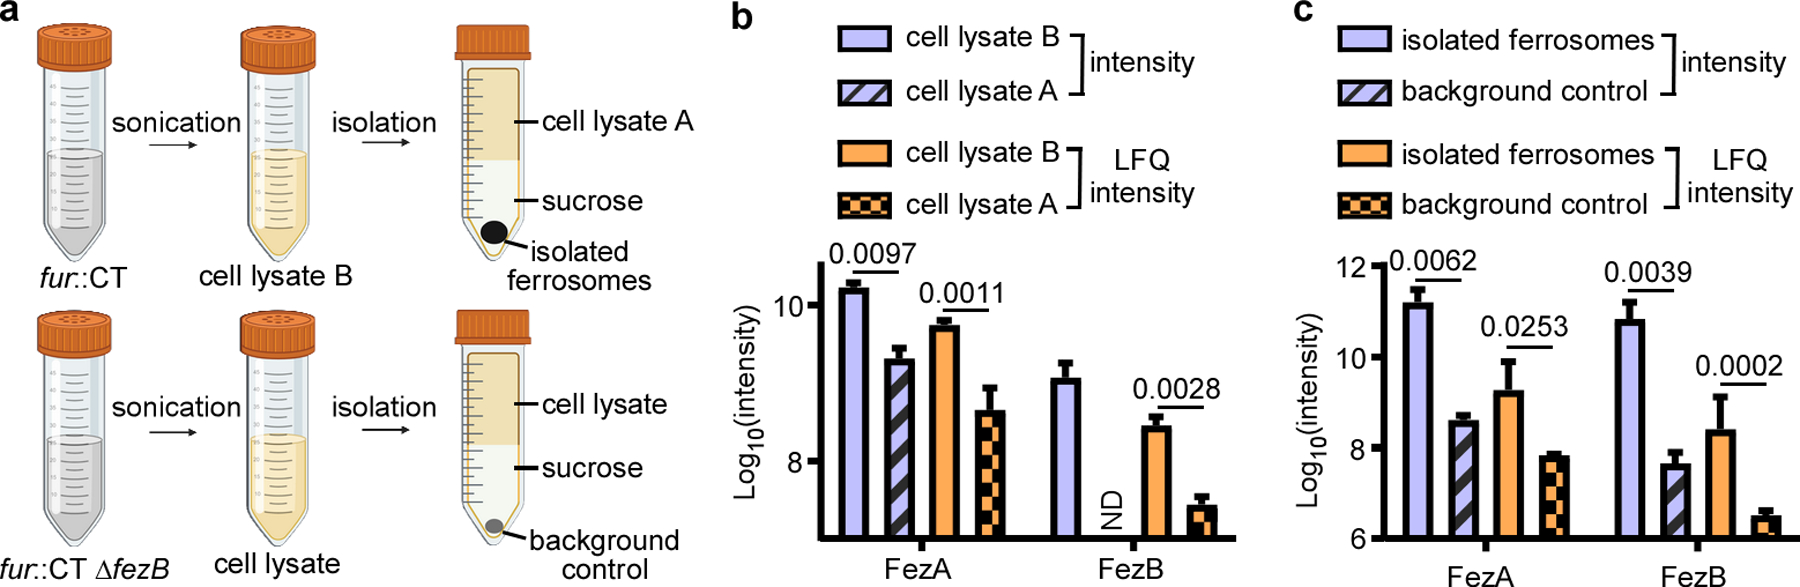
(a) Schematic of the proteomics experiment. Two comparisons were performed: (b) between the cell lysates of fur::CT before (cell lysate B) and after ferrosome isolation (cell lysate A), and (c) between the isolated ferrosomes from fur::CT cells and the background control ( fur::CT ΔfezB). Data shown are both raw intensity and label-free quantification (LFQ) intensity. ND, not detectable. Data are presented as mean ± STD (n = 3). Statistical analyses were done using two-tailed t-test and the p values are denoted in the graphs.