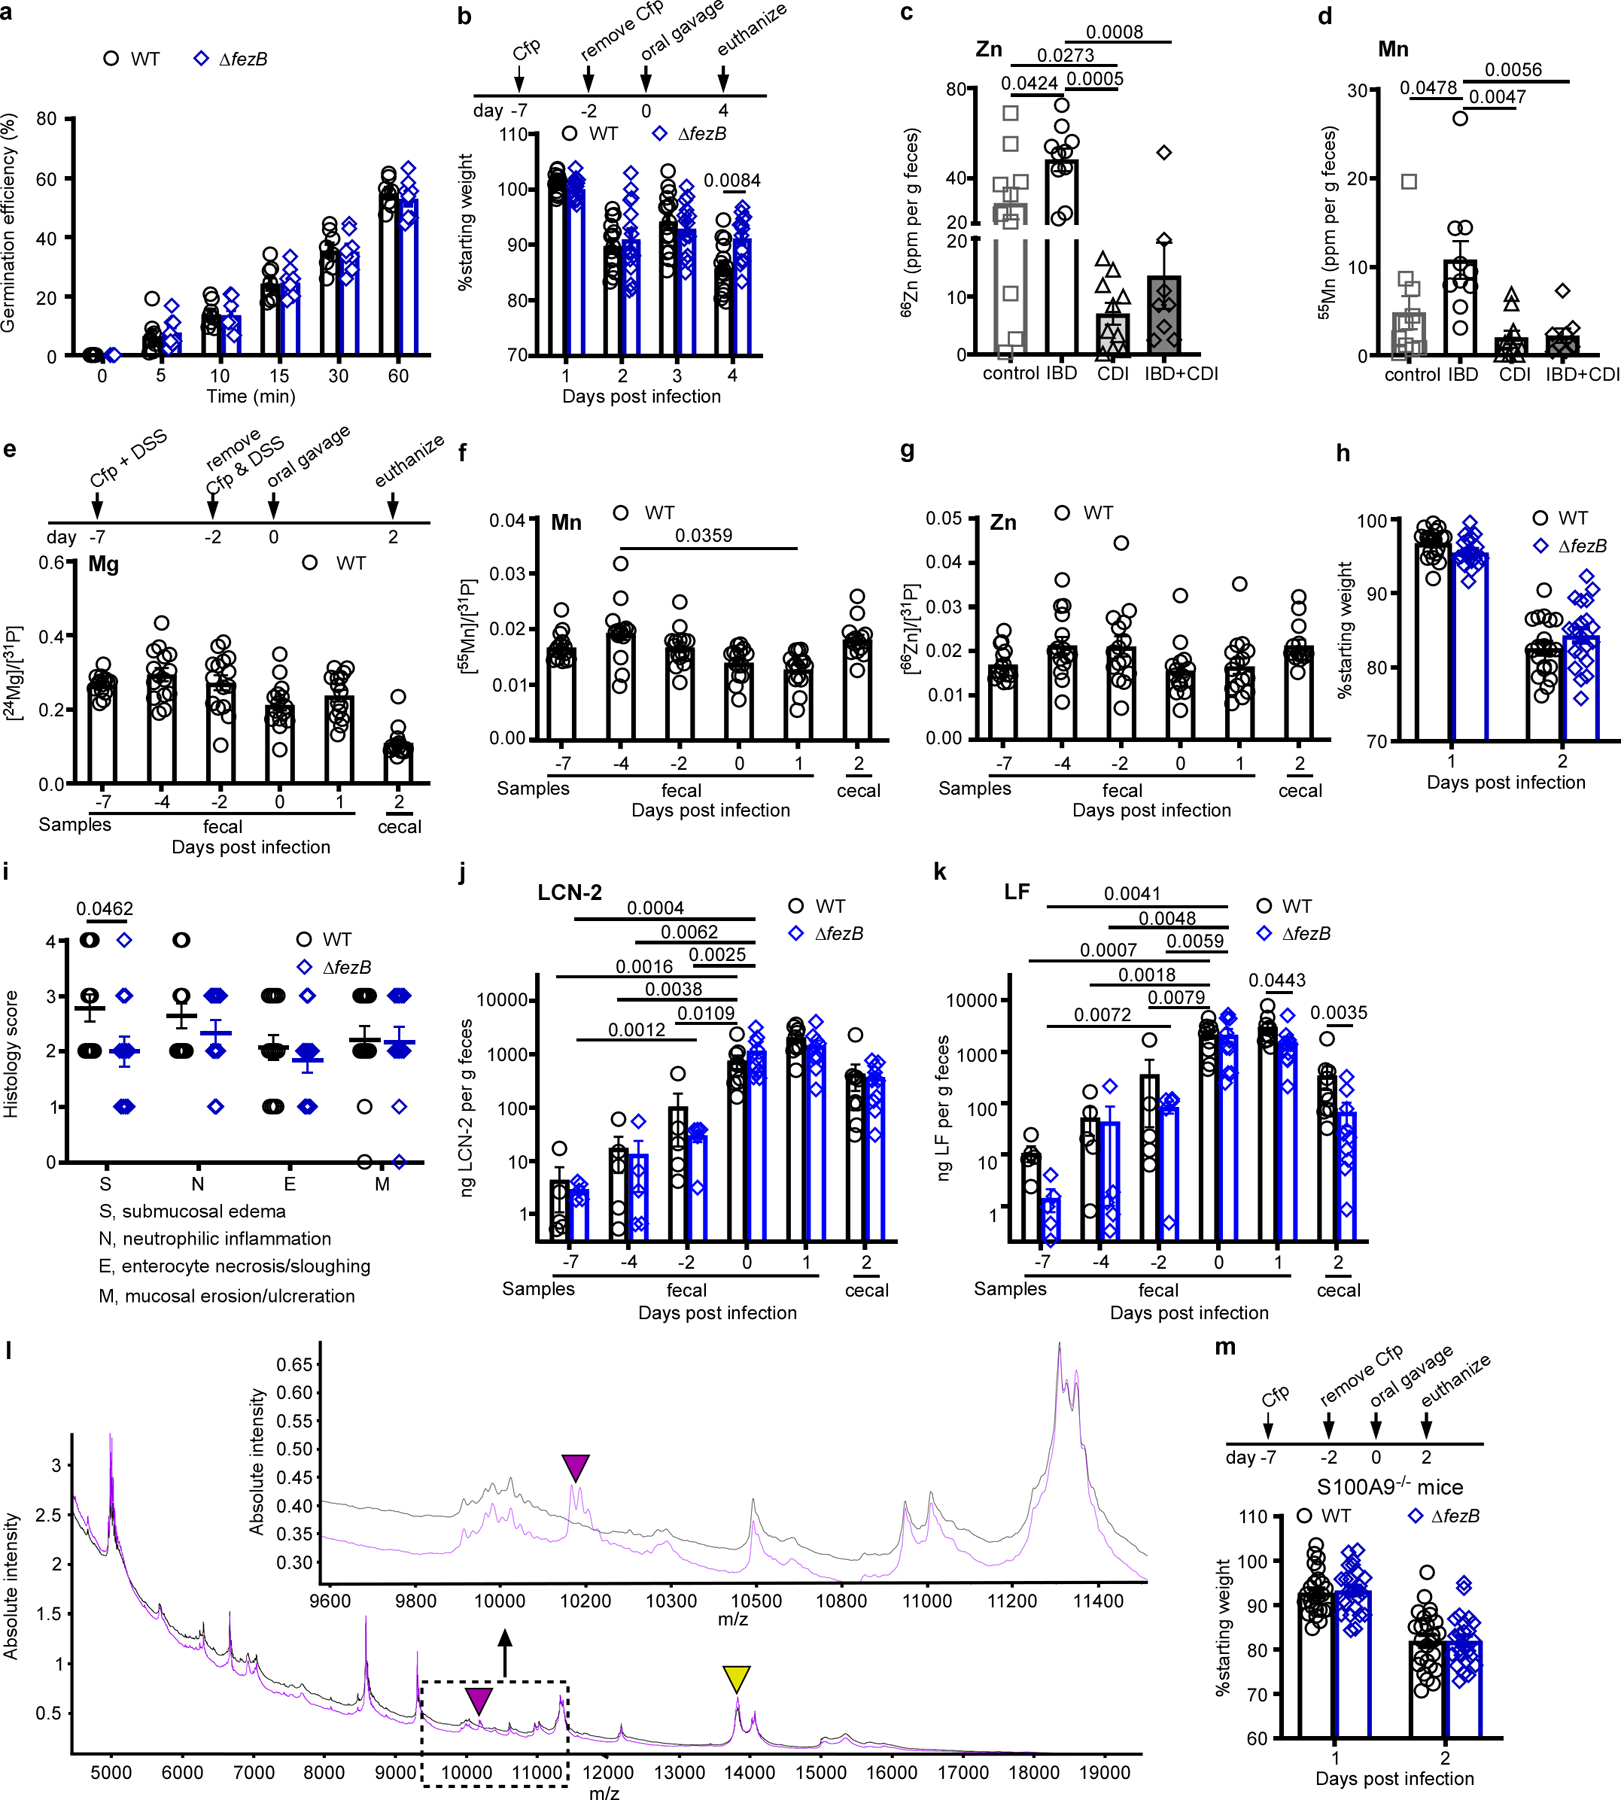
Extended Data Fig. 10 |. C. difficile resists host-mediated iron sequestration through ferrosome formation.

(a) Germination efficiency was examined using C. difficile WT or ΔfezB spores (n = 8). (b) Body weight of C57BL/6 J mice infected with C. difficile WT or ΔfezB spores (n = 20). Mice were treated with cefoperazone (Cfp) prior to infection. (c) Zn and (d) Mn levels were quantified by ICP-MS in fecal samples from four groups of pediatric patients: control (cancer patients), IBD, CDI, and IBD + CDI. The data are expressed as ppm (parts per million) per gram feces, n = 10 for all groups except the group of IBD + CDI (n = 8). (e-k) Infection studies were conducted using an inflammation model where mice were treated with both Cfp and DSS (dextran sulfate sodium) for 5 days (n = 20). (e) Mg, (f) Mn, (g) Zn levels (n = 10), and (h) body weight (n = 20) were monitored. (i) Histology scores were based on the areas of colon that were most severely affected as pathology was often multifocal to segmental. The scoring rubrics are: 0, not present; 1, mild, rare, scattered; 2, moderate, multifocal; 3, marked, locally extensive; and 4, marked, severe, diffuse. (j) Lipocalin (LCN−2) and (k) lactoferrin (LF) levels were quantified during infection. (l) MALDI IMS spectrum showing protein signals, including those associated with calprotectin (S100A8, m/z 10,164, indicated by a purple triangle) and an unidentified protein (m/z 13,807, annotated by a yellow triangle) from murine colon tissue from S100A9−/− (black) or C57BL/6 J (purple) mice infected with C. difficile WT spores. (Inset) Selected window from the protein MALDI IMS spectrum showing protein signal from calprotectin (S100A8, m/z 10,164 indicated with a purple arrow). (m) Body weight of S100A9−/− mice infected with C. difficile WT or ΔfezB spores (n = 25). Mice were treated with Cfp prior to infection. (e-g, j-k, and m) Fecal samples were used for all timepoints except the end timepoint (day 2 or 4), when the mice were euthanized and cecal samples were used. All data are mean ± SEM. Statistical analyses were done using (a-b, h-i, m) two-tailed t tests, ( j-k) two-way ANOVA, or (c-g) one-way ANOVA and the significant p values are denoted in the graphs.
