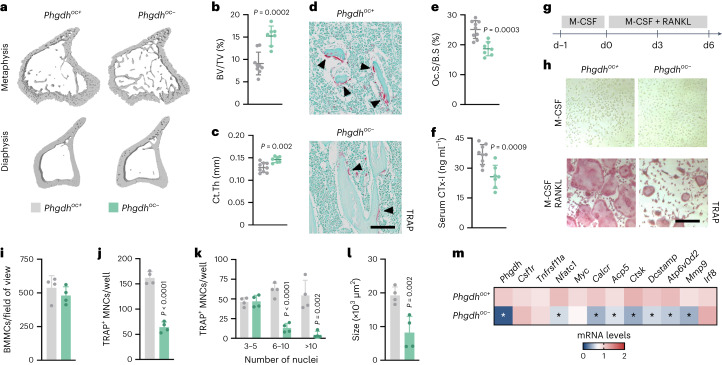
Fig. 2. PHGDH in osteoclasts controls bone resorption and postnatal bone mass.
a–c, Three-dimensional (3D) micro-CT models (a) of the tibial metaphysis (top) and diaphysis (bottom) with quantification of trabecular bone volume (BV/TV; b) and cortical thickness (Ct.Th; c) in wild-type (Phgdhoc+) and osteoclast-specific PHGDH knockout (Phgdhoc−) mice (n = 9 Phgdhoc+ and 7 Phgdhoc− mice; unpaired, two-tailed Student’s t-test). d,e, TRAP staining of the tibial metaphysis (d) with quantification (e) of osteoclast surface per bone surface (Oc.S/B.S) in Phgdhoc+ and Phgdhoc− mice (n = 9 Phgdhoc+ and 7 Phgdhoc− mice; unpaired, two-tailed Student’s t-test). Scale bar, 100 µm. f, Serum CTx-I levels in Phgdhoc+ and Phgdhoc− mice (n = 9 Phgdhoc+ and 7 Phgdhoc− mice; unpaired, two-tailed Student’s t-test). g, Schematic overview of the experimental setup used to study osteoclast differentiation. h, TRAP staining of osteoclast progenitors (upper) and osteoclasts (lower) from Phgdhoc+ and Phgdhoc− mice treated with M-CSF alone or M-CSF and RANKL, respectively (n = 4). Scale bar, 50 µm. i–l, Number of BMMCs (i), total number of TRAP-positive (TRAP+) MNCs (j), number of TRAP+ MNCs with indication of number of nuclei per cell (k) and average size of TRAP+ MNCs (l) from Phgdhoc+ and Phgdhoc− mice after M-CSF and RANKL treatment (n = 4; all unpaired, two-tailed Student’s t-test). m, Phgdh (P < 0.0001), Csf1r, Tnfrsf11a (encoding RANK), Nfatc1 (P = 0.002), Myc, Calcr (P = 0.0002), Acp5 (P = 0.008), Ctsk (P = 0.0002), Dcstamp (P = 0.0016), Atp6v0d2 (P = 0.007), Mmp9 (P = 0.010) and Irf8 mRNA levels in cultured osteoclasts from Phgdhoc+ and Phgdhoc− mice after M-CSF and RANKL treatment (n = 4; unpaired, two-tailed Student’s t-test with *P < 0.05 versus Phgdhoc+). Data are means ± s.d.

