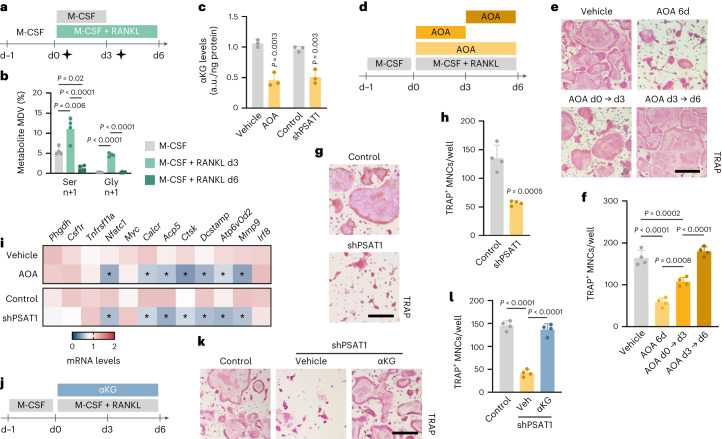
Fig. 4. The SSP enzyme PSAT1 generates αKG during early osteoclastogenesis.
a, Schematic overview of experimental setup for metabolomics analysis during osteoclastogenesis. [13C5/15N2]glutamine tracer was added (black stars) from d0 to d3 (that is, early differentiation), or from d3 to d6 (that is, late differentiation). b, Ser and Gly labelling from [13C5/15N2]glutamine at different timepoints during osteoclast differentiation (n = 4; one-way ANOVA). Relevant MDVs are shown; n denotes specific labelling from nitrogen. c, Intracellular αKG levels in vehicle and AOA-treated osteoclasts, or in control and PSAT1-silenced (shPSAT1) osteoclasts (n = 4; unpaired, two-tailed Student’s t-test). An empty vector was used as shRNA control. d, Schematic overview of experimental setup. Osteoclasts were treated with AOA during the first 3 d, the last 3 d or during the entire experiment. e,f, TRAP staining (e) and quantification of TRAP+ MNCs (f) from wild-type mice treated with either vehicle or AOA (n = 4; one-way ANOVA). g,h, TRAP staining (g) and quantification of TRAP+ MNCs (h) after shRNA-mediated silencing of PSAT1 (n = 4 biologically independent samples; unpaired, two-tailed Student’s t-test). An empty vector was used as control. i, Phgdh, Csf1r, Tnfrsf11a (encoding RANK), Nfatc1 (AOA: P = 0.002; shPSAT1: P = 0.008), Myc, Calcr (AOA: P = 0.006; shPSAT1: P = 0.013), Acp5 (AOA: P = 0.03; shPSAT1: P = 0.007), Ctsk (AOA: P < 0.0001; shPSAT1: P = 0.048), Dcstamp (AOA: P = 0.0095; shPSAT1: P = 0.013), Atp6v0d2 (AOA: P = 0.04; shPSAT1: P = 0.011), Mmp9 (AOA: P = 0.005; shPSAT1: P = 0.04) and Irf8 mRNA levels in AOA-treated or PSAT1-silenced osteoclasts (n = 4; unpaired, two-tailed Student’s t-test with *P < 0.05 versus vehicle/control). j, Schematic overview of experimental setup. PSAT1-silenced osteoclasts were treated with cell-permeable αKG during the entire experiment. k,l, TRAP staining (k) and quantification of control and αKG-treated PSAT1-silenced TRAP+ MNCs (l) (n = 4 biologically independent samples; one-way ANOVA). Data are means ± s.d. Scale bars, 50 µm (e, g and k).

