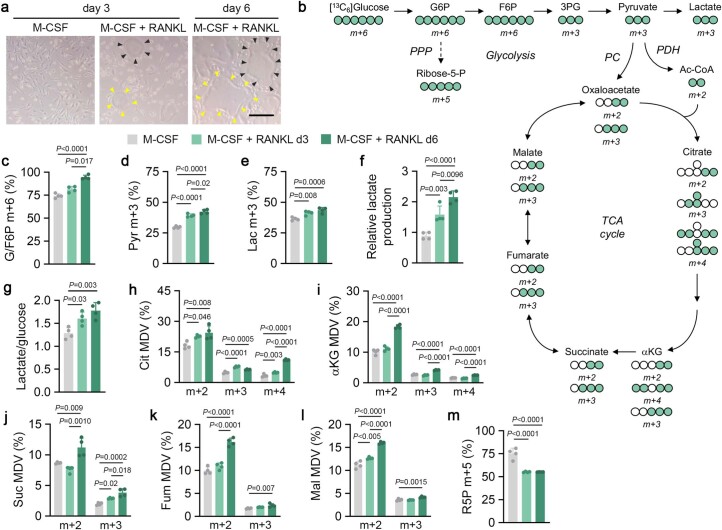
Extended Data Fig. 1. Analysis of glucose metabolism during osteoclast differentiation.
a Representative pictures of osteoclast differentiation at indicated timepoints. Black and yellow arrowheads indicate osteoclasts. Scale bar is 50 µm. Representative pictures of 4 biological replicates are shown. b Schematic of carbon atom (circles) transitions of [13C6]glucose used to detect label incorporation into indicated metabolites. G6P is glucose-6-phosphate, F6P is fructose-6-phosphate, 3PG is 3-phosphoglycerate, Ac-CoA is acetyl-CoA, aKG is α-ketoglutarate. c-e G6P/F6P (c), pyruvate (Pyr; d) lactate (Lac; e) labeling from [13C6]glucose at different timepoints during osteoclast differentiation (n = 4; one-way ANOVA). f, g Relative lactate production (f) and ratio of lactate production over glucose consumption (g) (n = 4; one-way ANOVA). h-m Citrate (Cit; h), aKG (i), succinate (Suc; j), fumarate (Fum; k), malate (Mal; l) and ribose-5-phosphate (R5P; m) labeling from [13C6]glucose (n = 4; one-way ANOVA). Data are means ± s.d. Relevant mass distribution vectors (MDVs) are shown in (c-e) and (h-m).

