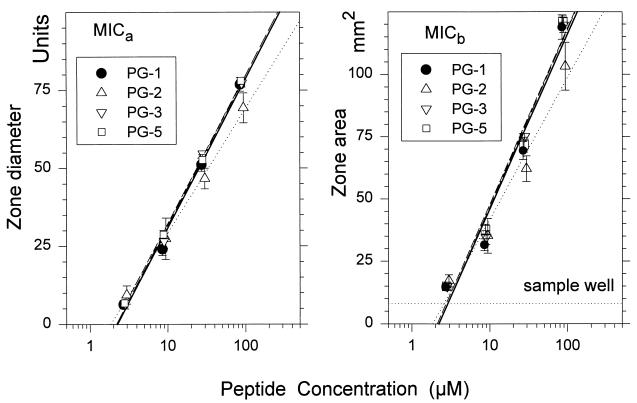
FIG. 2.
Two-stage radial diffusion assays. PG-1, -2, -3, and -5 were tested against C. albicans. The sample size was 5 μl, and no albumin was used in the diluent. Each symbol represents a mean value from three replicate experiments, except that for PG-1 (n = 7). Error bars show SEMs. The regression lines (least-mean-squares fits) are as follows: for PG-1 data, thick and solid, for PG-2 data, dotted; for PG-3 data, dashed; for PG-5 data, thin and solid. The left panel illustrates data that would be analyzed in a MICa calculation. The right panel shows the same data as they would be expressed to determine the MICb.

