
Figure 2.
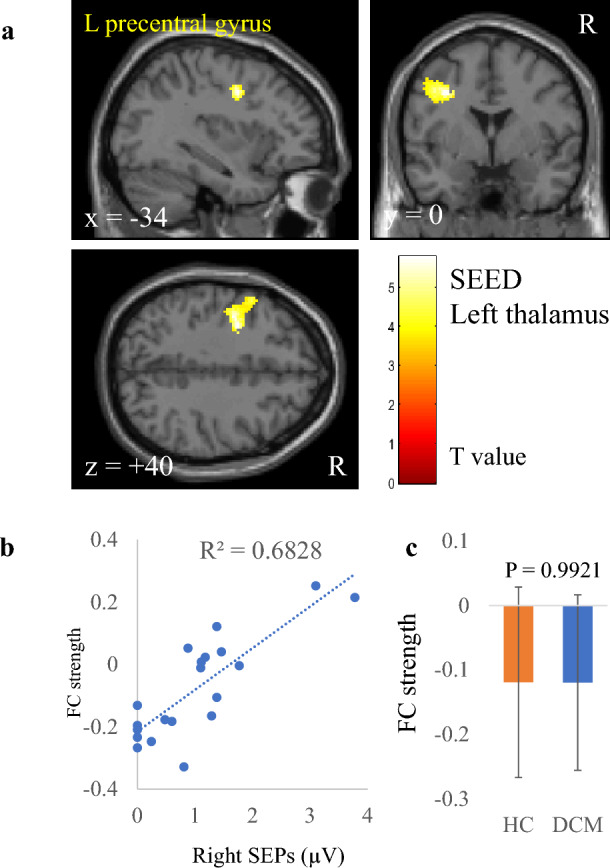
Correlation between right somatosensory evoked potentials (SEP) amplitude and functional connectivity (FC) strength of the left thalamus. (a) A cluster showing a significant positive correlation between right SEP and FC strength of the left thalamus, (b) scatter plot of right SEP versus FC strength, and (c) comparison of FC strengths between patients with degenerative cervical myelopathy (DCM) and healthy controls (HC). The dashed line in panel (b) is the regression line. Error bars in panel (c) represent standard deviations.