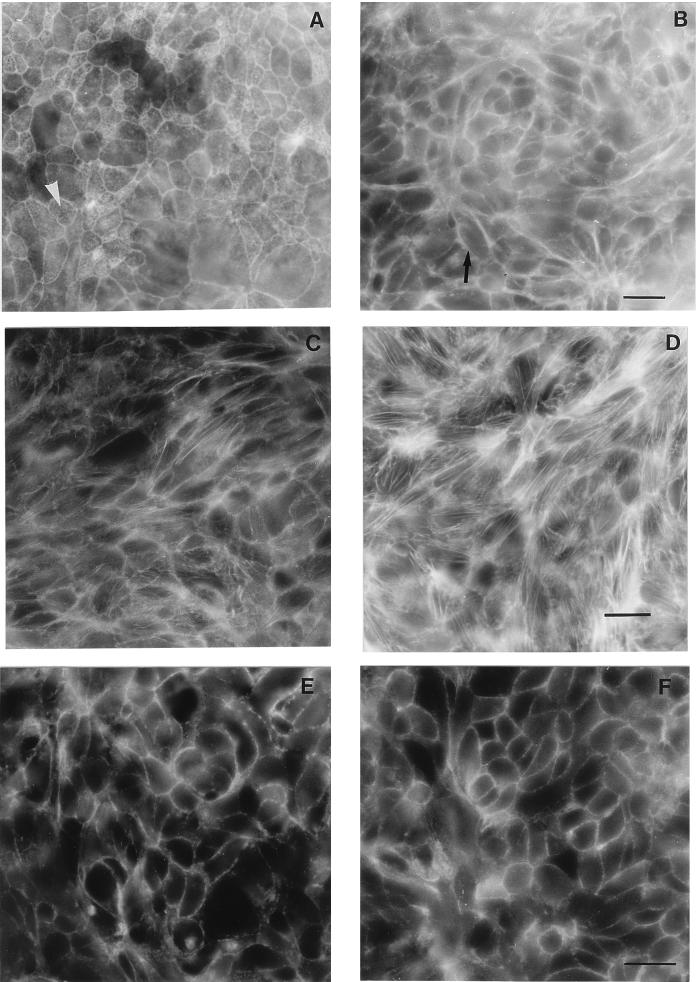
FIG. 1.
F-actin and ZO-1 fluorescent staining of T84 cell monolayers incubated with or without CNF1. (A and C) F-actin contents of apical and basolateral faces, respectively, of control cells. (B and D) F-actin contents of apical and basolateral faces, respectively, of cells treated with CNF1 (10−10 M) for 16 h. The arrow in panel B shows the absence of F-actin microvilli, whereas the arrowhead in panel A shows F-actin present in microvilli. (E and F) Distribution of the junctional protein ZO-1 in T84 control cells and in T84 cells exposed to CNF1 (10−10 M) for 16 h, respectively. Bars, 10 μm.

