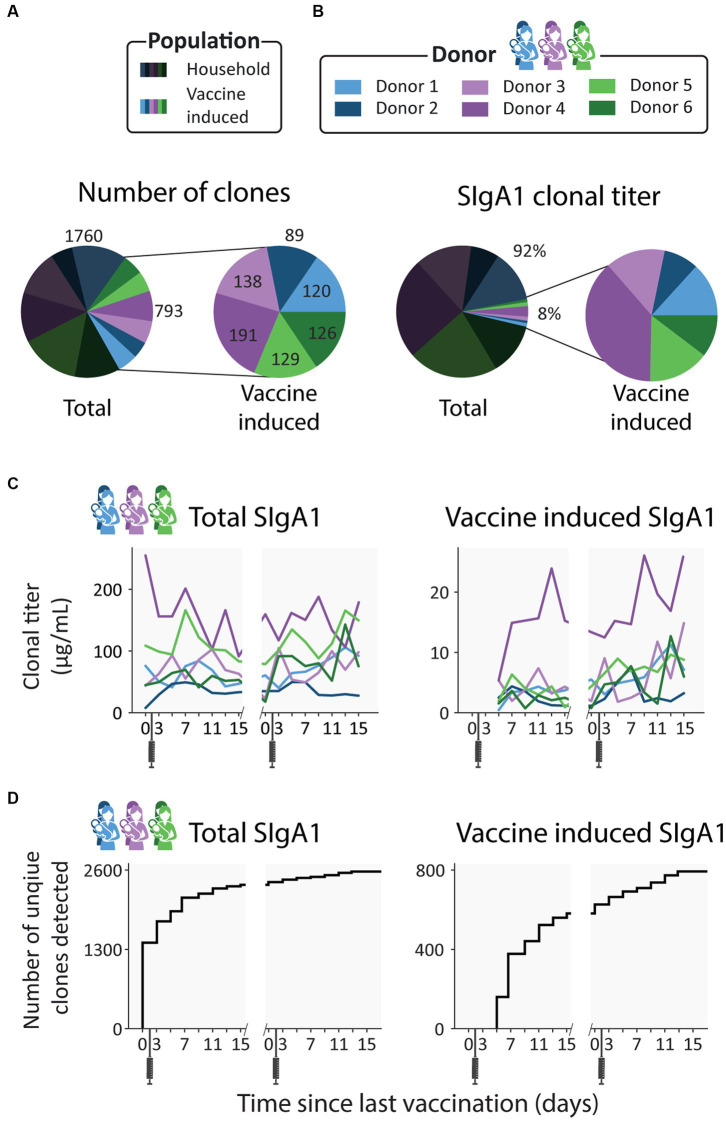
Figure 2.
Emergence of novel clones after vaccination. (A) Pie charts showing the number of unique clones designated as household (dark) and vaccine induced (light), colored per donor. Vaccine induced clones made up 31% of all detected clones (793 out of 2553 clones). (B) Pie charts showing the percent total abundance the household clones (dark) and vaccine induced clones (light), colored per donor. (C) Longitudinal changes in total SIgA1 clonal titer (left) and vaccine induced SIgA1 clonal titers (right) for each donor. Vaccine induced SIgA1 clonal titers rise in response to the repeated vaccinations and make up an average of 7% of the total SIgA1 clonal titer. (D) Total number of unique clones detected over time (left) and number of unique vaccine induced clones (right). Novel clones emerge shortly after vaccination and by day 7 nearly half of all vaccine induced clones (377 out of 793) have been detected.

