Figure 3.
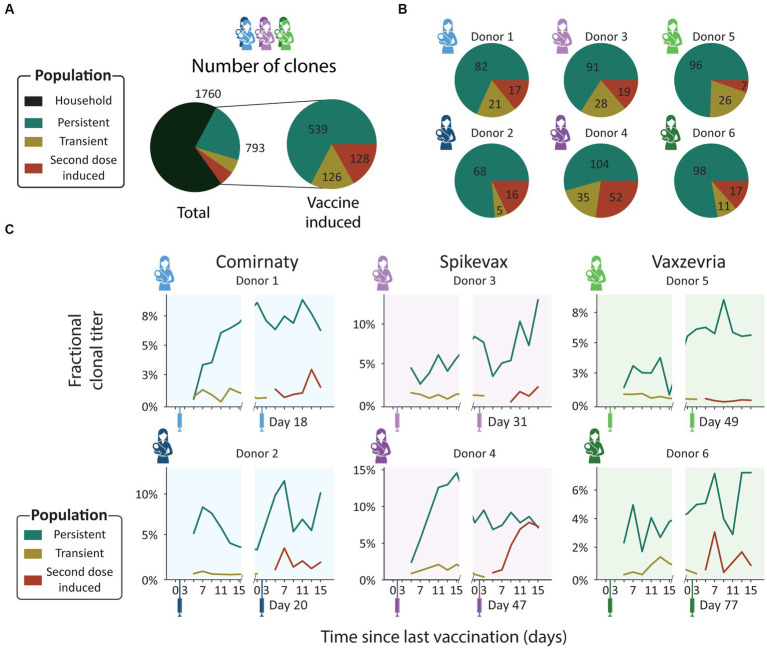
Clonal population analysis. (A) Pie charts showing the total number of unique clones in each population. Clones were assigned to populations based on their detection window relative to the vaccination moments: persistent (teal), transient (mustard), and second dose induced clones (maroon). (B) Pie charts showing the number of unique clones in each population per donor. Each pie chart shows data for a single donor [Comirnaty (2 blue donors), Spikevax (2 purple donors) and Vaxzevria (2 green donors)]. (C) Longitudinal changes in fractional clonal titer (i.e., fraction of the total clonal titer made up by each population) for the vaccine induced clonal populations. Vaccination moments are depicted as color-coded syringes. Each panel shows donor-specific, fractional clonal titers for the three vaccine induced populations. While all donors show a unique repertoire without overlapping clones, varying in number of clones and total clonal titer, when grouped into populations the responses are more consistent. Persistent clones make up the bulk of the vaccine induced SIgA1 clonal titer at nearly every timepoint. The clonal titers of the transient and second dose induced populations account for a much smaller fraction of SIgA1.

