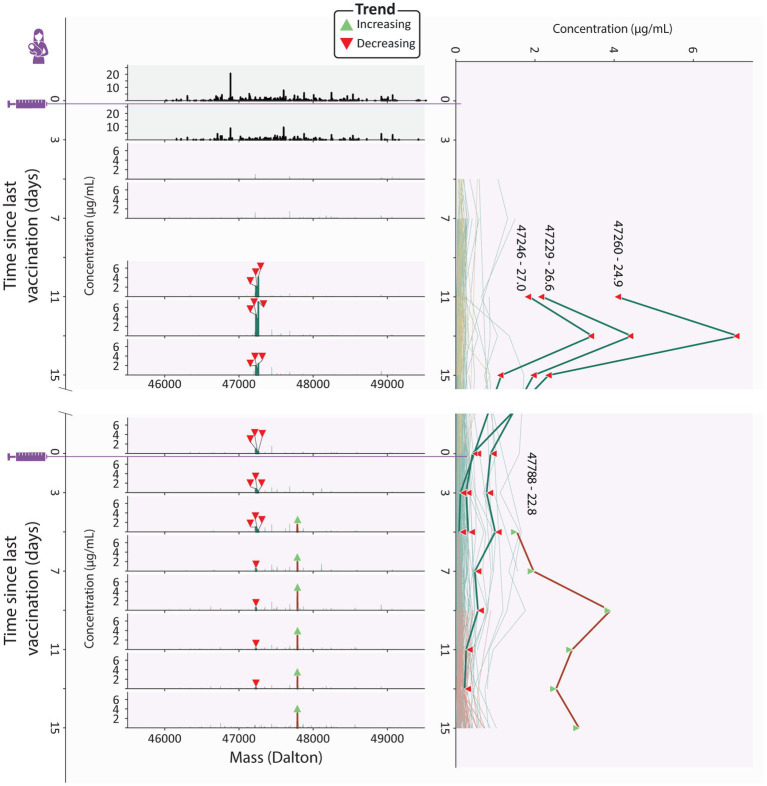
Figure 4.
Clonal profile analysis for donor 4, a strong responder. Changes in the vaccine induced clonal profile for donor 4 are depicted, with the 4 most abundant vaccine induced clones annotated by their mass and retention time, highlighted in bold, with each timepoint annotated with a triangle indicating if the clone trends upwards or downwards in concentration over the course of this study. On the left we show mass profiles (SIgA1 clonal concentration in μg/mL) showing either household clones (top two profiles, in black) or vaccine induced clones [subsequent profiles, with individual clones colored according to their assigned population (persistent (teal), transient (mustard), and second dose induced clones (maroon))]. Each peak indicates a single clone and each row a single timepoint. The line plot on the right shows the abundance of individual vaccine induced SIgA1 clones over all timepoints, colored by their population, with the same clones as the mass plots highlighted in bold, labeled with their mass and retention times and annotated with triangles indicating if the clone trends upwards or downwards in concentration throughout the study duration. The highlighted persistent clones are initially highly abundant, but their abundance decreases rapidly, and at the final timepoint none of them are detected. The highlighted second dose induced clone is part of a large and abundant population of second dose induced clones, which at the final timepoints make up 45-50% of the vaccine induced clonal titer.

