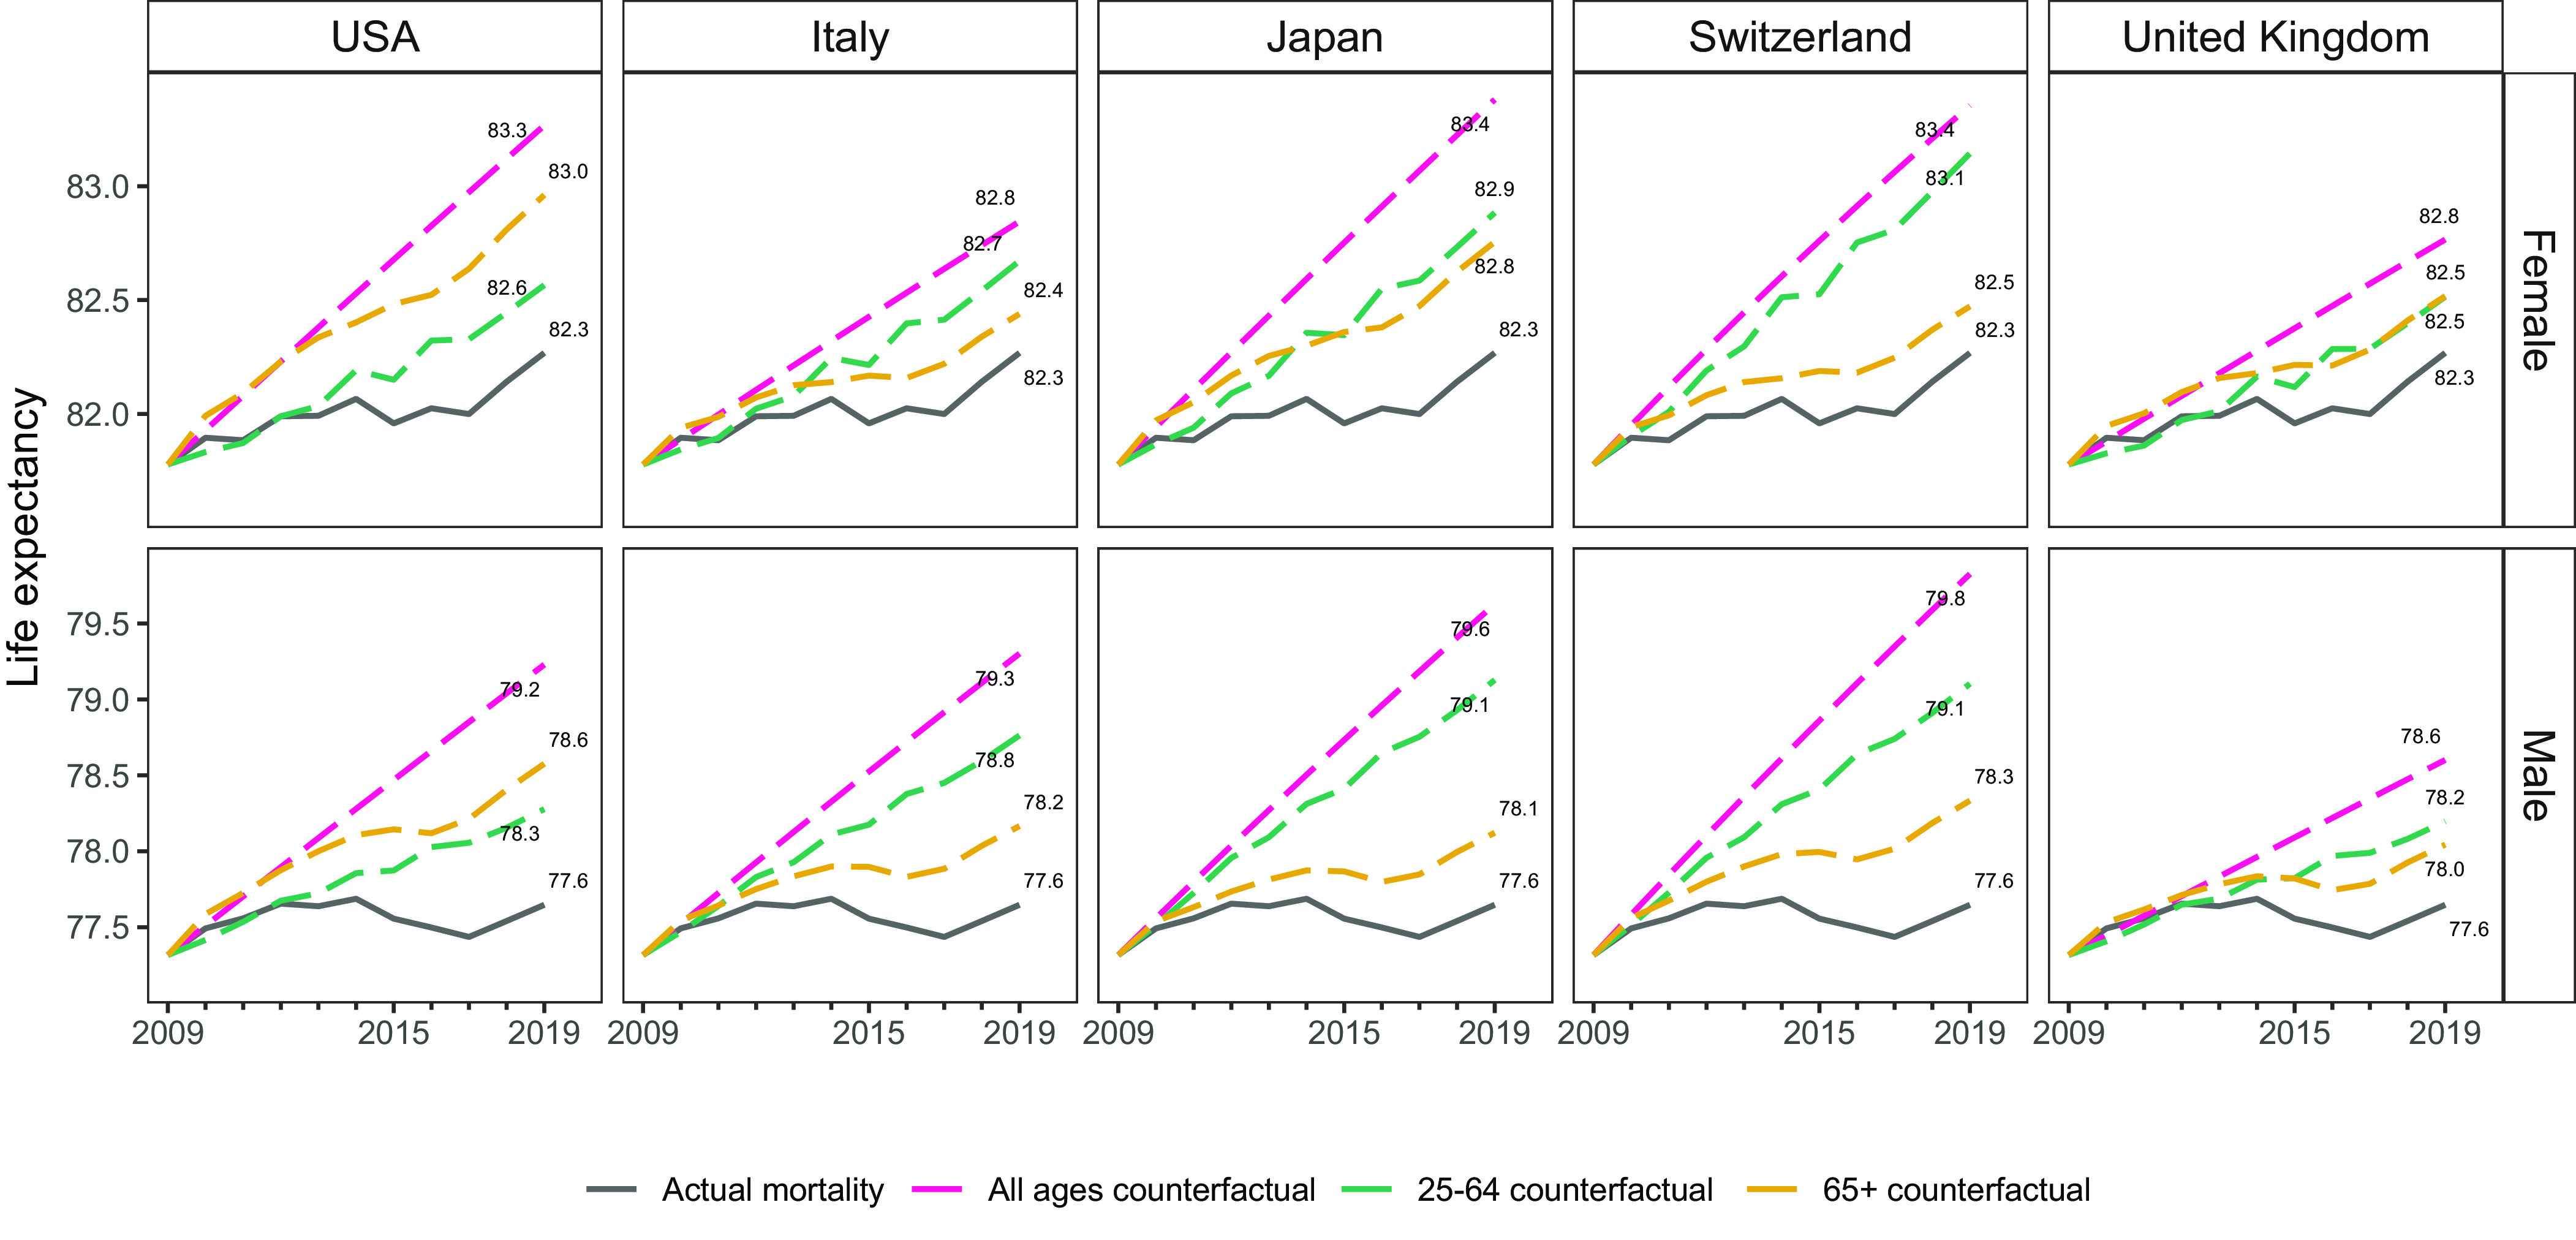
Fig. 2.

Observed and counterfactual life expectancy at age 25 in the United States, 2009 to 2019 (e25 + 25). Note: The USA panel assumes continuation of US 2000 to 2009 ROMI. Remaining panels assume country-specific 2010 to 2019 ROMI would have applied in the United States. Source: Authors’ calculation based on data from the Human Mortality Database (4).
