Fig. 1.
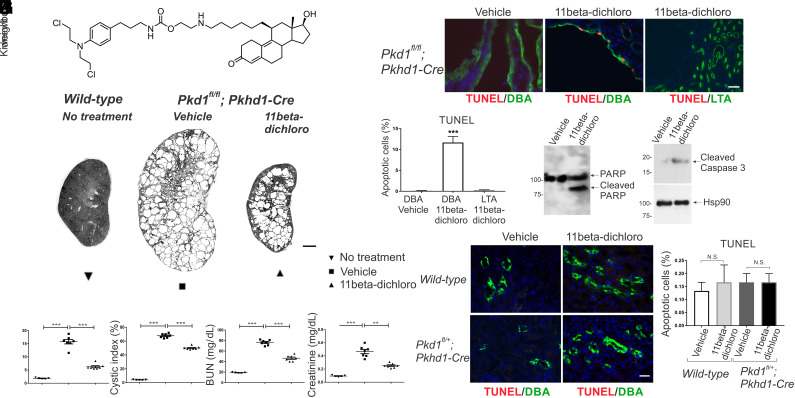
11Beta-dichloro ameliorates cystic disease in an early model of PKD by inducing apoptosis in cystic cells. (A) Structure of 11beta-dichloro. (B) Representative whole-kidney hematoxylin & eosin (H&E) scans of wild-type (Left), vehicle-treated (Middle), and 11beta-dichloro-treated (Right) kidneys at P24. (Scale bar, 1 mm.) Vehicle-only or 11beta-dichloro (10 mg/kg) was given i.p. daily from P10 to P23 and mice were analyzed at P24. Morphological—(C) two kidney/body weight ratio and (D) cystic index—and functional parameters—(E) BUN and (F) creatinine—show that treatment with 11beta-dichloro improved disease progression compared with vehicle-treated mice (n = 5 for WT, n = 7 for both vehicle- and 11beta-dichloro-treated cystic kidneys). (G) Apoptosis was evaluated in cyst lining epithelia at P24 by TUNEL staining. Compared with vehicle-treated or wild-type kidneys, 11beta-dichloro increased apoptosis in the DBA-positive (collecting duct) Cre-expressing segments. (Scale bar, 20 µm.) (H) Quantitation of the apoptotic index (percentage TUNEL-positive cells) in (G); three kidneys from three different mice per genotype and experimental condition were analyzed and >1,000 DBA-positive cells were counted for each sample. Apoptosis markers (I) cleaved PARP and (J) cleaved caspase three were increased in the 11beta-dichloro-treated vs. vehicle-treated kidneys as seen by immunoblotting. (K) Wild-type and Pkd1fl/+;Pkhd1-Cre (heterozygous controls) mice were treated with 11beta-dichloro (10 mg/kg) from P10 to P23 and apoptosis was assessed via TUNEL staining. (Scale bar, 20 µm.) No increase in apoptosis was observed in the DBA-positive segments (green staining). (L) Quantification of the apoptotic index in (K), three kidneys from three different mice per genotype and kidney condition, >1,000 DBA-positive cells counted. Statistics: N.S., not significant (P > 0.05); **P < 0.01; ***P < 0.001 determined by ANOVA (C–F) or t test (H and L). Data are plotted as mean ± SEM.

