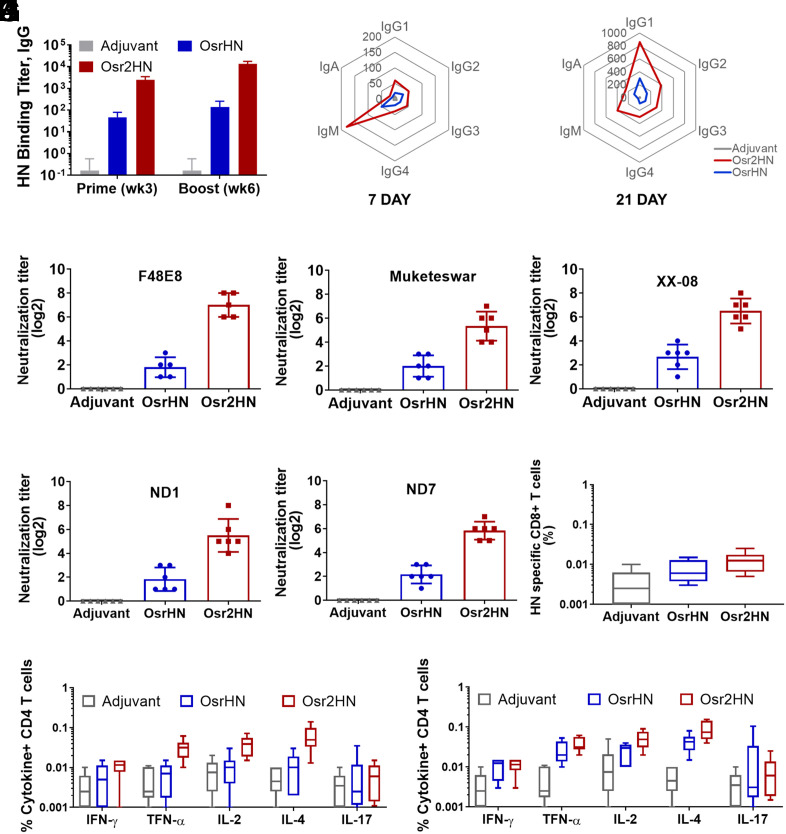
Fig. 3.
Comparison of the immune responses induced by HN dimer and monomer in mice. (A) Antibody response induced by Osr2HN and OsrHN vaccination in mice. Serum samples were collected in the third week after the first and second immunizations and tested by the ELISA assay. Error bars indicate SEM data averaged from eight chickens per group. (B) Radar plot showing the Osr2HN and OsrHN induced antibody subclass at 7 d after the immunization. (C) Radar plot showing the Osr2HN and OsrHN induced antibody subclass at 21 d after the immunization. (D–H) Virus Neutralization assays were performed using sera from treatment groups collected on day 28 after booster immunization against five strains of NDV. The F48E8 strain is shown in (D), the Muketeswar strain in (E), the XX-08 strain in (F), and ND1 and ND7 strains in (G) and (H), respectively. The results displayed are representative titers from one of three independent experiments, with error bars indicating the SEM. (I) HN-specific CD8+T cells in the blood at week 3 after boosting immunization with Osr2HN and OsrHN. (J) HN-specific CD4+T cells in the blood at week 3 after boosting immunization with 0.5 µg Osr2HN and OsrHN. (K) HN-specific CD4+T cells in the blood at week 3 after boosting immunization with 10 µg Osr2HN and OsrHN.

