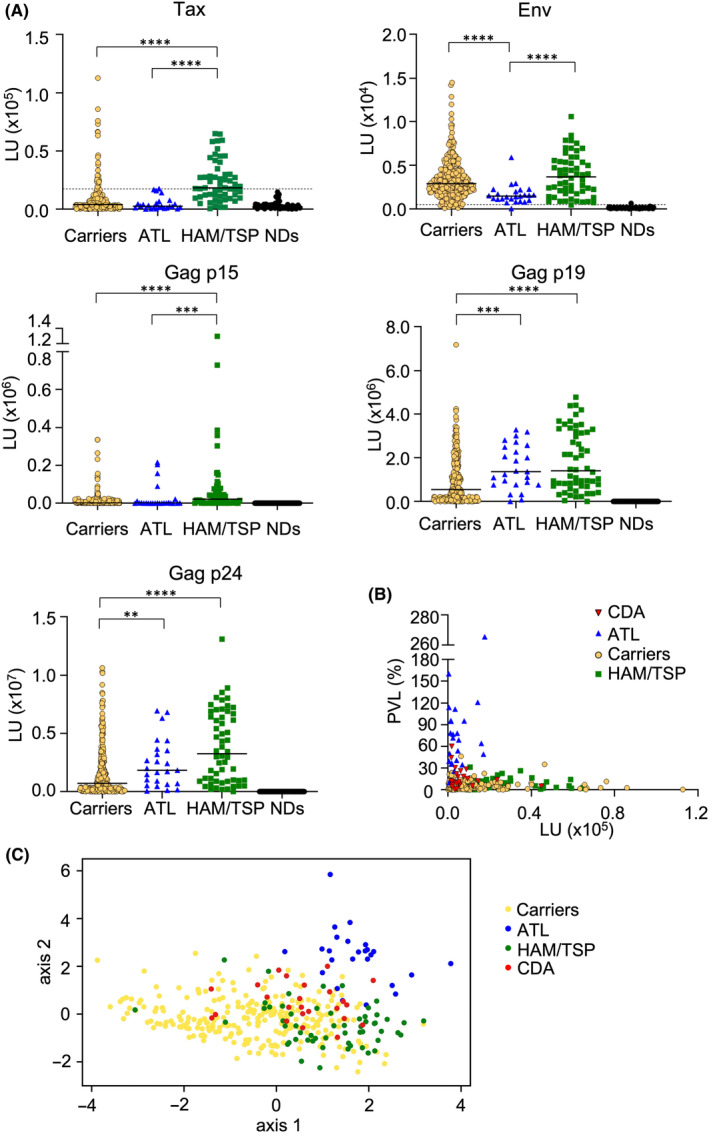
FIGURE 1.

Antibody responses analyzed by luciferase immunoprecipitation system (LIPS) in human T‐cell leukemia virus type 1 (HTLV‐1) associated diseases. (A) The horizontal bar represents the median. The dotted lines are cutoff values calculated from the mean value of seronegative donors plus five standard deviations (SDs), as reported previously. 28 SDs of seronegative donors (NDs) were 2887, 75.63, 88.88, 455.6, and 1071 for Tax, Env, p15, p19, and p24, respectively. **P < 0.01, ***P < 0.005, ****P < 0.0001. (B) Tax antibody and proviral load (PVL) in carriers who developed ATL (CDA), ATL patients, HTLV‐1 carriers, and HTLV‐1‐associated myelopathy/tropical spastic paraparesis (HAM/TSP) patients. (C) PLS analysis using PVL and antibody responses to Tax, Env, and Gag. The scale of the PLS plot is a non‐dimensional quantity since horizontal and vertical axes represent integrated characteristics regarding symptoms.
