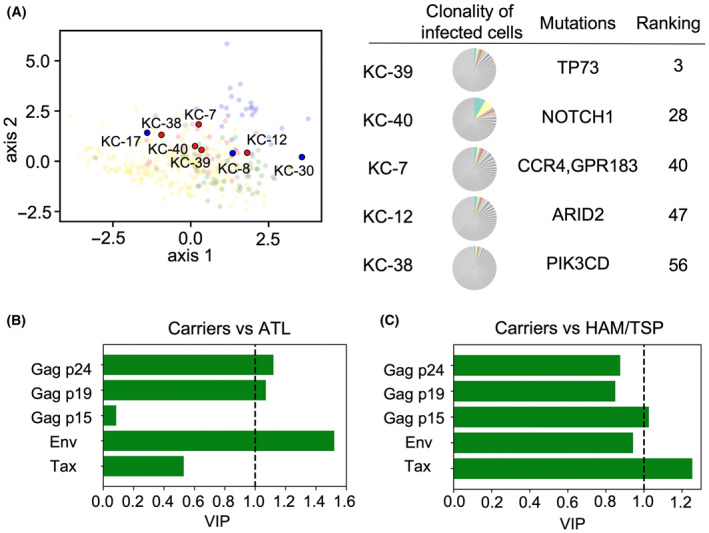
FIGURE 2.

Identification of predictive markers for the development of ATL or human T‐cell leukemia virus type 1‐associated myelopathy/tropical spastic paraparesis (HAM/TSP). (A) Eight carriers were analyzed for somatic mutations of driver genes and clonality of infected cells. Red dots represent cases with at least one detected mutation, and blue dots represent cases with no detected mutation. Colored portions of pie charts represent the top 10 clones of each case. (B,C) VIP scores for prediction of ATL (B) and HAM/TSP (C). The VIP score for each variable represents the mathematical degree of contribution of that variable to the disease type (ATL or HAM/TSP). To determine whether a variable (PVL/antibody titer) is important or not based on the VIP score, a conventional criterion (threshold equal to 1) was employed (See Appendix S1 for details). Note that the VIP score represents the relative importance of an antibody's contribution to the assignment of a sample to a cluster.
