FIGURE 3.

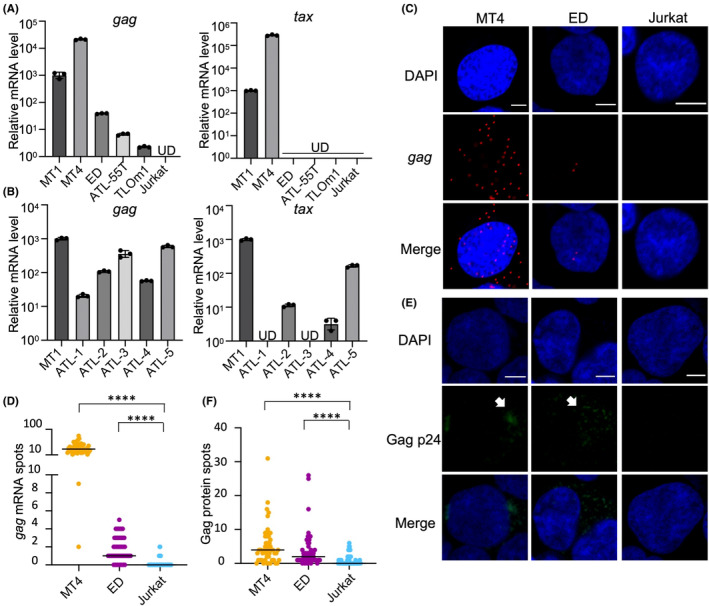
Gag expression in ATL cells. (A) RT‐qPCR of tax and gag in human T‐cell leukemia virus type 1 (HTLV‐1) infected cell lines and Jurkat cells. For quantification of gag mRNA, a no reverse transcriptase negative control was made, and gag mRNA was not detected. UD, undetected. (B) RT‐qPCR of tax and gag in primary ATL cells. All samples were obtained from ATL patients in which more than 80% of PBMCs were CD4+CADM1+, and they were confirmed to be monoclonal by inverse PCR. The amount of 18S rRNA in each sample was quantified and used as a reference to calculate the relative expression levels of tax and gag with the ddCt method. (C) RNA‐FISH of HTLV‐1 infected cell lines and Jurkat cells (scale bar, 5 μm). (D) gag mRNA spots per cell detected by RNA‐FISH in HTLV‐1‐infected cell lines and Jurkat cells. ****p < 0.0001. (E) Duolink PLA of HTLV‐1 infected cell lines and Jurkat cells (scale bar, 5 μm). Arrows indicate the signals of p24 protein. (F) Gag protein spots per cell detected by Duolink PLA in HTLV‐1 infected cell lines and Jurkat cells. ****p < 0.0001.
