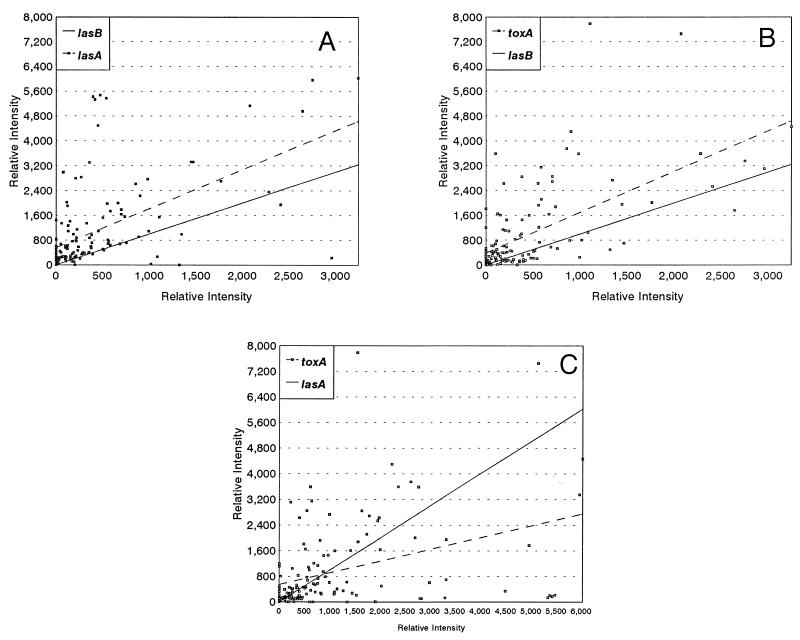
FIG. 1.
Scatter plots for the population transcript accumulations for lasA, lasB, and toxA. In these plots the results for 131 sputum samples are presented. For each sample, 10 μg of the total RNA extracted from the pelleted bacterial population was blotted onto a Nytran membrane (Schleicher and Schuell) and hybridized with the toxA probe. The blots were then washed to remove the probe, and the membrane was rehybridized with the lasB probe. The process was repeated with the lasA probe. The relative intensity for the sample was measured from the autoradiograph with a soft laser scanning densitometer. The results represent 10 μg of RNA from equivalent numbers of cells. (A and B) Comparison of lasB population transcript accumulation to lasA (A) and toxA (B) population transcript accumulations. The results were sorted to generate a linear plot for the lasB hybridizations. The solid lines represent the sorted results. The dashed lines represent the trend line for lasA or toxA. (C) Comparison of lasA population transcript accumulation to toxA population transcript accumulation. The results were sorted to generate a linear plot for the lasA. The solid line represents the sorted results. The dashed line represents the trend line for toxA.

