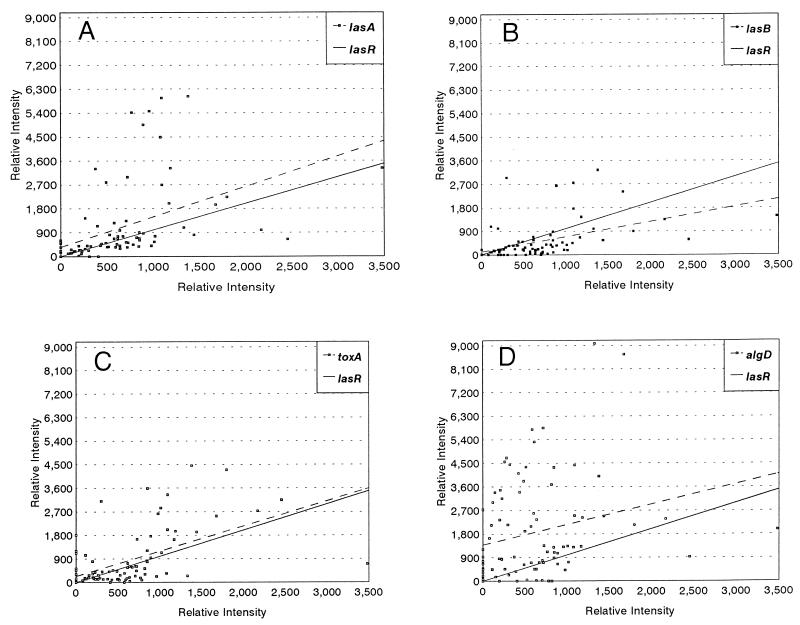
FIG. 3.
Scatter plots for the population transcript accumulations for lasR, lasA, lasB, toxA, and algD. In these plots the results for 84 sputum samples are presented. The samples were prepared as described in the legend for Fig. 2. For all four panels the results were sorted to generate a linear plot for the lasR hybridizations. The solid lines represent the sorted results. The dashed lines represent the trend line for lasA, lasB, toxA, or algD. lasR population transcript accumulation was compared to lasA population transcript accumulation (A), lasB population transcript accumulation (B), toxA population transcript accumulation (C), and algD population transcript accumulation (D).

