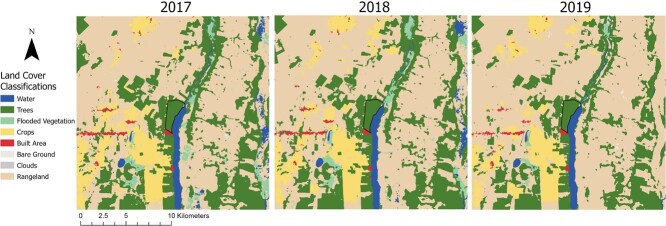
Figure 1.
Map of land cover change in northern Belize, within 10 km of the LAR, from 2017 to 2019. The 450-ha forest of the LAR is shown in black (Becker et al., 2020). Map and land use/land cover data were derived from the Sentinel-2 10 m land use/land cover time series of the world produced by Impact Observatory, Microsoft and Esri (Karra et al., 2021). This dataset is based on the data produced for the Dynamic World Project by National Geographic Society in partnership with Google and the World Resources Institute.

