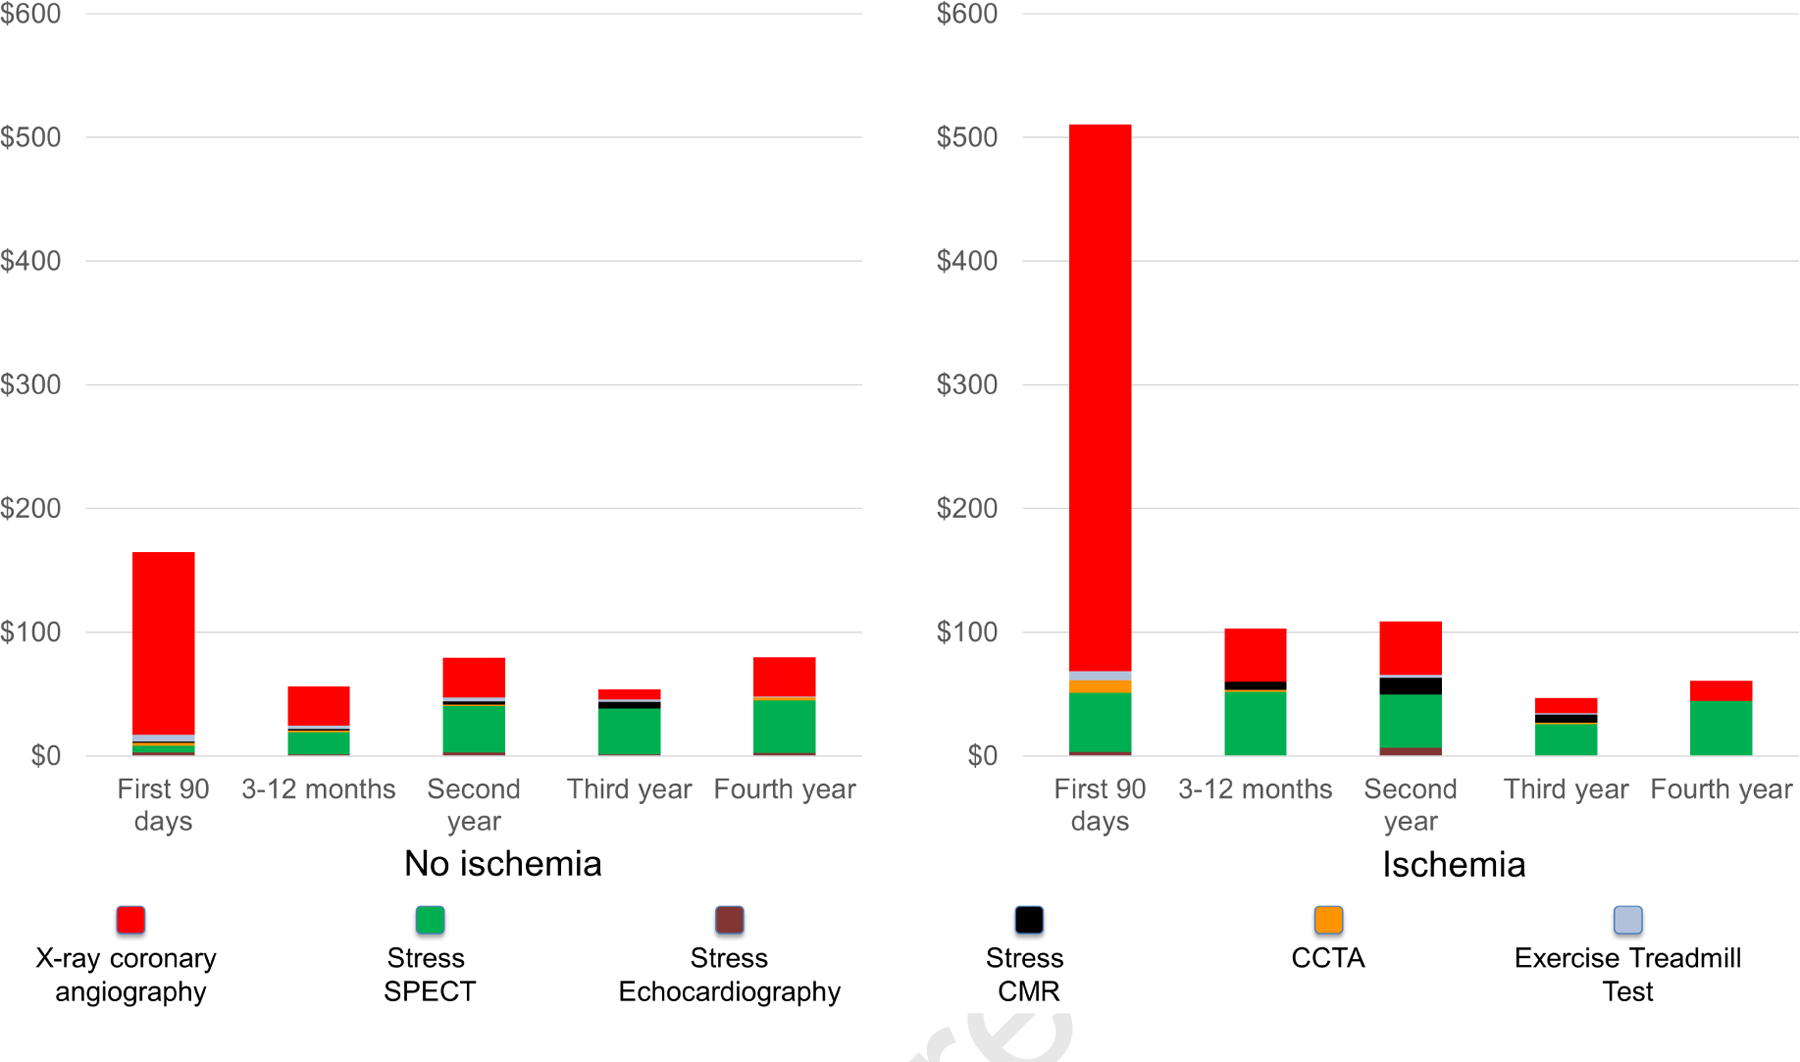
Central Illustration:

The left panel shows an example of a CMR study showing a stress perfusion defect (dark arrowheads) with its myocardial extent exceeding the 2 foci of subsegmental LGE (red arrows). This suggested ischemia from flow-limiting coronary stenosis in the right coronary artery. The right panel shows time-to-event curves of the study cohort for primary outcome, stratified by presence vs. absence of ischemia and according to LVEF 40–50% vs. <40%.
