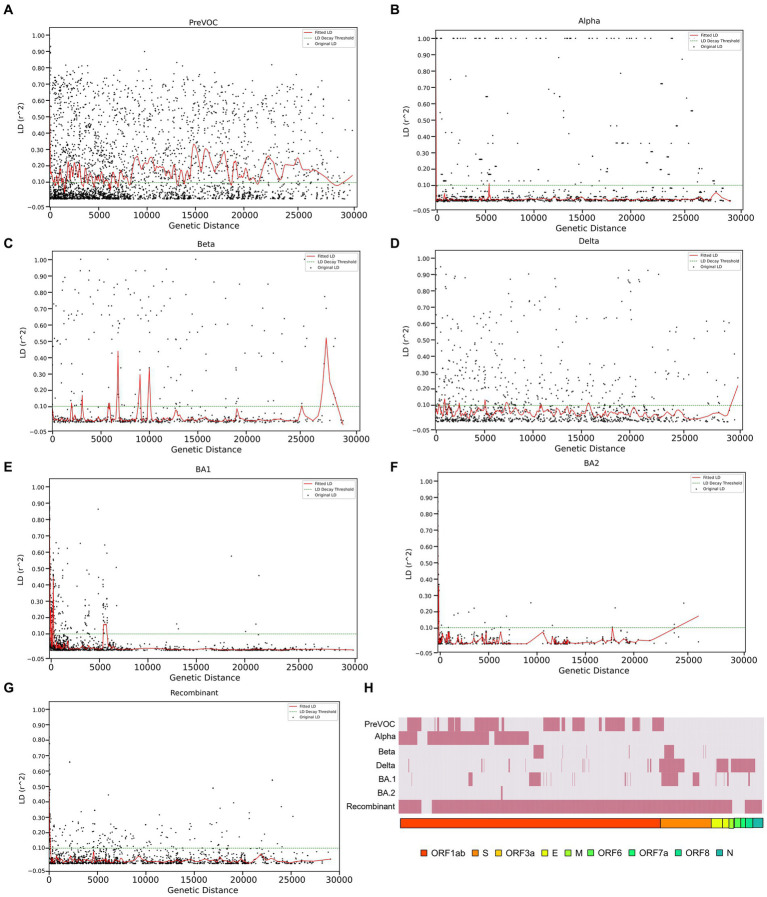
Figure 6.
LD decay patterns from the Pre-VOC to the Recombinant. LD decay plot with the fitted original LD. (A) Pre-VOC, (B) Alpha (C) Beta, (D) Delta, (E) BA.1, (F) BA.2, and (G) Recombinant. The y-axis denotes LD (r2) between pairwise combinations of the variant sites, with x-axis denoting distance between these sites. (H) Heatmap showing recombination breakpoints from the Pre-VOC to the Recombinant, red signifies breakpoint position.

