

Abstract
Background
Nonalcoholic fatty liver disease (NAFLD) is a chronic liver disease associated with metabolic syndrome. It is the most common cause of cryptogenic cirrhosis. The disease is also involved in the occurrence and development of type 2 diabetes and atherosclerosis and can directly affect the outcome of patients with coronary heart disease. Therefore, the focus of treatment of nonalcoholic fatty liver disease has also begun to focus on the treatment of risk factors for atherosclerotic heart disease. In this study, we investigated the difference between patients with coronary artery stenosis combined with NAFLD and those without NAFLD and evaluated the predictive factors and value of functional coronary artery ischemia in patients with NAFLD.
Hypothesis
Many clinical factors (such as age, BMI, hyperglycemia) and imaging parameters (such as CACS grade) in the NAFLD group were different from those in the non‐NAFLD group. The predictive model combined with multiple influencing factors has a good value in predicting coronary artery ischemia in patients with NAFLD.
Methods
We collected the clinical and imaging data of patients who underwent coronary computed tomography angiography and coronary artery calcification score (CACS) scans between January and June 2023. A total of 392 patients were included and divided into the NAFLD group and the non‐NAFLD group. Based on CT fractional flow reserve (CT‐FFR), patients with NAFLD were divided into CT‐FFR ≤ 0.08 group and CT‐FFR > 0.08 group.
Results
Significant differences were observed between the non‐NAFLD and NAFLD groups in terms of age, body mass index, hyperglycemia, hyperlipidemia, triglyceride, high‐density lipoprotein, coronary artery disease‐reporting and data system (CAD‐RADS) classification, CACS classification, number of diseased coronary arteries, and CT‐FFR ≤ 0.80 ratio (p < .05). The CAD‐RADS and CACS classifications can independently predict functional coronary artery ischemia in NAFLD patients. The combined use of CAD‐RADS and CACS classifications resulted in an area under the curve of 0.819 (95% confidence interval: 0.761–0.876) for predicting coronary artery ischemia in NAFLD patients, which was higher than the individual classification methods (CAD‐RADS: 0.762, CACS: 0.742) (p = .000).
Conclusions
There are differences between patients with coronary artery stenosis and NAFLD and those without NAFLD. The CAD‐RADS classification and CACS classification can economically and efficiently predict functional coronary artery ischemia in patients with NAFLD, which has crucial value in clinical diagnosis and treatment.
Keywords: CACS, CAD‐RADS, CCTA, CT‐FFR, NAFLD
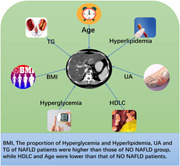
Statistically significant difference factors between patients with nonalcoholic fatty liver disease (NAFLD) and those without NAFLD. Body mass index, the proportion of hyperglycemia and hyperlipidemia, UA, and TG of NAFLD patients were higher than those of the NO NAFLD group, while HDLC and Age were lower than that of NO NAFLD patients.
Abbreviations
- AUC
areas under curve
- BMI
body mass index
- CACS
coronary artery calcification score
- CAD‐RADS
coronary artery disease‐reporting and data system
- CCTA
coronary computed tomography angiography
- CPR
cardiopulmonary resuscitation
- CT‐FFR
CT fractional flow reserve
- FFR
fractional flow reserve
- NAFLD
nonalcoholic fatty liver disease
- ROC
receiver operating characteristic
- VR
volume rendering
1. INTRODUCTION
Nonalcoholic fatty liver disease (NAFLD) is a chronic liver disease associated with metabolic syndrome and is the primary cause of chronic liver disease worldwide. 1 This disease not only causes decompensated cirrhosis, liver transplant rejection, and hepatocellular carcinoma, but it also contributes to the occurrence and development of type 2 diabetes mellitus and atherosclerosis. NAFLD is associated with increased liver‐related incidence or mortality rates. Cardiovascular disease is the primary cause of death in patients with NAFLD. 2 It is most closely associated with cardiovascular disease. 3 Several stages of the occurrence and development of cardiovascular disease may be affected by inflammatory reactions and changes in lipid hormone levels in NAFLD, which have a direct impact on the prognosis of coronary heart disease. 4 , 5 Numerous studies have demonstrated that traditional risk factors for coronary heart disease, such as hypertension, dyslipidemia, obesity, and smoking, 6 , 7 are also risk factors for NAFLD. Other studies 8 have shown that patients with NAFLD are more likely to develop coronary microvascular dysfunction than patients without NAFLD.
In 2016, the Society of Cardiovascular Computed Tomography released the coronary artery disease‐reporting and data system (CAD‐RADS) 1.0, which is widely recognized and utilized throughout the world. 9 CAD‐RADS classifies patients based on coronary computed tomography angiography (CCTA) results, which represent the most severe level of coronary artery disease. Prior research 10 , 11 has demonstrated the high diagnostic accuracy and prognostic value of CAD‐RADS. In recent years, CT fractional flow reserve (CT‐FFR) has emerged as a focal point of clinical research and application. It can reliably identify coronary artery ischemic lesions with a single examination, assisting physicians in determining the vessels responsible for myocardial ischemia. 12 , 13 , 14 Numerous studies have confirmed that CT‐FFR and invasive FFR have high consistency and accuracy in diagnosing specific ischemic lesions. coronary artery calcification score (CACS) is a noninvasive CT technique that detects and reflects the burden of coronary calcified plaque, and it is a favorable tool for the evaluation of coronary heart disease. Several investigations 15 have indicated that liver diseases due to NAFLD are significantly associated with coronary artery calcification. In this study, we analyzed the difference between patients with coronary artery stenosis combined with NAFLD and those without NAFLD. We explored the predictive factors of functional coronary artery ischemia in patients with NAFLD based on CT‐FFR, providing a theoretical basis for early clinical diagnosis and risk stratification of coronary artery ischemia in patients with NAFLD.
2. DATA AND METHODS
2.1. Participants and data
A total of 921 hospitalized patients who underwent CCTA examinations and CACS scans at the Fifth Affiliated Hospital of Zhengzhou University between January 2023 and June 2023 were screened retrospectively. Exclusion criteria: (1) history of cardiac surgery, including percutaneous coronary intervention, coronary artery bypass grafting, cardiac pacemaker implantation, and valve replacement; (2) history of liver disease other than NAFLD, such as live cancer and cirrhosis; and (3) poor image quality of CCTA. Ultimately, 392 patients, including 209 patients combined with NAFLD and 183 patients without NAFLD, were enrolled to collect clinical and imaging data. NAFLD is defined as nonenhanced CT liver attenuation (liver–spleen CT values < 1 HU) or liver CT value/spleen CT value ≤ 1 HU, without clinical evidence of liver disease, cirrhosis, or alcohol abuse. 16
2.2. CCTA and CACS scanning protocols
All patients underwent CCTA and CACS using a 256‐slice spiral CT scanner (Philips, Brilliance iCT). Patients received breath‐hold training before scanning to reduce motion artifacts, and those with high heart rates were given metoprolol to lower their heart rate below 65 bpm. To ensure adequate coronary artery dilatation, patients were instructed to take nitroglycerin sublingually within 2–5 minutes before scanning. CACS scanning was performed before a nonenhanced CT scan. The contrast agent iohexol (60–80 mL) was injected through the elbow vein at a flow rate of 4–5 mL/s using a double‐cylinder high‐pressure injector. Using the automatic contrast agent tracking threshold triggering technique, the trigger site was located between the ascending aorta and tracheal bifurcation. When the trigger threshold reached 150 HU, the scanning was delayed for 4.2 seconds. Subsequently, the CCTA images were reconstructed using iterative reconstruction technology, and the phase with the best image quality was selected for the postprocessing analysis of the CCTA. The CACS was automatically calculated by Agatston Calcium Score Software (Heart Beat‐CS) and divided into three categories: CACS = 0, 1–99, and ≥100.
2.3. CCTA characteristic analysis
The optimal image was transferred to the artificial intelligence software (United Imaging Intelligence, uAI Discovery‐Coronary CTA) to obtain the coronary CT‐FFR value. A total of 20 mm distal to the lesion, the CT‐FFR value was determined. CT‐FFR ≤ 0.8 indicates coronary artery ischemia, whereas CT‐FFR > 0.8 indicates absence of ischemia (Figure 1A–E). The CAD‐RADS classification was based on the results of CCTA, 9 and its reference criteria were as shown in Table 1. In this study, CAD‐RADS 3–5 categories were combined into a single group for analysis. All of the above procedures were performed independently by two senior imaging diagnosticians with extensive postprocessing experience, and only those with consistent results were included in the study.
Figure 1.
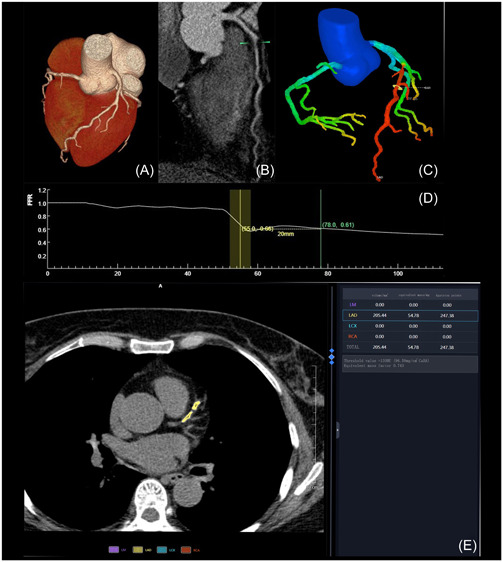
(A) Cardiac volume rendering image (VR); (B) computed tomography angiography curved planar reformation image; (C) VR coronary tree color map; (D) CT fractional flow reserve value curve; (E) coronary artery calcification score calculation interface.
Table 1.
Reference table for CAD‐RADS classification.
| Degree of maximal coronary stenosis | CAD‐RADS categories |
|---|---|
| 0% (No plaque or stenosis) | 0 |
| 1%–24% (Minimal stenosis or plaque with no stenosis) | 1 |
| 25%–49% (Mild stenosis) | 2 |
| 50%–69% | 3 |
| 70%–99% | 4A |
| Left main >50% or three‐vessel obstructive (≥70%) disease | 4B |
| 100% (total occlusion) | 5 |
Abbreviation: CAD‐RADS, coronary artery disease‐reporting and data system.
2.4. Statistical analysis of data
SPSS 26.0 statistical software was used for data analysis. The Kolmogorov–Smirnov method was used to test the normality of measurement data. Continuous variables conforming to the normal distribution are expressed as mean ± SD. The t test was used for comparison between the two groups. Counting data are expressed as %, and the chi‐squared test was used to compare the difference between the two groups. Univariate and multivariate logistic regression analyses were used to investigate the correlation between functional coronary artery ischemia and various variables. The predictive value of factors was evaluated through receiver operating characteristic (ROC) curves and area under the curve (AUC) analysis. The difference was statistically significant (p < .05).
3. RESULTS
3.1. Clinical data
There was no statistical difference in males, hypertension, current smoking, total cholesterol, or low‐density lipoprotein between the NAFLD group and the non‐NAFLD group (p > .05). Table 2 displays statistically significant differences in age, body mass index (BMI), hyperglycemia, hyperlipidemia, uric acid, triglyceride, and high‐density lipoprotein (p < .05).
Table 2.
Comparison of clinical data between the non‐NAFLD group and the NAFLD group.
| Variable | No NAFLD(n = 183) | NAFLD(n = 209) | p Value |
|---|---|---|---|
| Male | 94 (51.4) | 125 (59.8) | .093 |
| Age | 64.06 ± 11.13 | 60.88 ± 10.67 | .004 |
| BMI | 24.19 ± 3.76 | 26.22 ± 3.14 | .000 |
| Hypertension | 106 (57.9) | 139 (66.5) | .080 |
| Hyperglycemia | 34 (18.6) | 83 (39.7) | .000 |
| Hyperlipidemia | 92 (50.3) | 147 (70.3) | .000 |
| Current smoking | 43 (23.5) | 53 (25.4) | .669 |
| UA | 306.04 ± 82.25 | 340.92 ± 89.65 | .000 |
| TC | 4.48 ± 1.06 | 4.48 ± 1.07 | .997 |
| TG | 1.49 ± 0.10 | 2.10 ± 1.44 | .000 |
| HDLC | 1.23 ± 0.28 | 1.11 ± 0.23 | .000 |
| LDLC | 2.33 ± 0.79 | 2.37 ± 0.80 | .651 |
| CAD‐RADS classification | .019 | ||
| 1 | 38 (20.8) | 28 (13.4) | |
| 2 | 79 (43.2) | 78 (37.3) | |
| 3–5 | 66 (36.1) | 103 (49.3) | |
| CACS classification | .030 | ||
| 1 | 32 (17.5) | 25 (12.0) | |
| 2 | 90 (49.2) | 88 (42.1) | |
| 3 | 61 (33.3) | 96 (45.9) | |
| Number of diseased coronary arteries | .040 | ||
| 1 | 77 (42.1) | 63 (30.1) | |
| 2 | 53 (29.0) | 67 (32.1) | |
| 3 | 53 (29.0) | 79 (37.8) | |
| CT‐FFR ≤ 0.80 | 71 (38.8) | 110 (52.6) | .006 |
Abbreviations: BMI, body mass, index; CACS, coronary artery calcification score; CAD‐RADS, coronary artery disease‐reporting and data system; CT‐FFR, CT fractional flow reserve; HDLC, high‐density lipoprotein cholesterol; LDLC, low‐density lipoprotein cholesterol; NAFLD, nonalcoholic fatty liver disease; TC, total cholesterol; TG, triglyceride; UA, uric acid.
3.2. Image features
CAD‐RADS classification, CACS classification, number of diseased coronary arteries, and the constituent ratio of CT‐FFR ≤ 0.80 were significantly different between the two groups (p < .05) (Table 2).
3.3. Predictive factor of functional coronary artery ischemia in patients with NAFLD
Univariate logistic regression analysis revealed a correlation between the number of diseased coronary arteries, CAD‐RADS classification, CACS classification, and patients with functional coronary artery ischemia in combination with NAFLD (p < .001). Further multivariate logistic regression analysis revealed CAD‐RADS classification and CACS classification as independent predictive factors for patients with functional coronary artery ischemia combined with NAFLD, and the incidence of functional coronary ischemia was positively correlated with CAD‐RADS classification (adjusted odds ratio [OR] = 3.383) and CACS classification (adjusted OR = 2.264) (Table 3). Based on the inclusion criteria of the ROC curve, the AUC of predicting coronary artery ischemia in patients combined with NAFLD was 0.762 for CAD‐RADS classification, 0.742 for CACS classification, and 0.819 for the combination of two indexes, with 95% confidence interval (CI) of 0.696–0.828, 0.673–0.811, and 0.761–0.876, respectively (all p = .000) (Figure 2).
Table 3.
Univariate and multivariate regression analysis of functional coronary artery ischemia in patients with NAFLD.
| Variable | Univariate analysis | Multivariate analysis | ||
|---|---|---|---|---|
| OR(95% CI) | p Value | OR(95%CI) | p Value | |
| Male | 0.983 (0.565 ~ 1.711) | .953 | ||
| Age | 1.008 (0.982 ~ 1.034) | .557 | ||
| BMI | 0.966 (0.886 ~ 1.054) | .966 | ||
| Hypertension | 1.518 (0.852 ~ 2.705) | .156 | ||
| Hyperglycemia | 1.471 (0.880 ~ 2.460) | .141 | ||
| Hyperlipidemia | 1.274 (0.703 ~ 2.308) | .425 | ||
| Current smoking | 1.884 (0.990 ~ 3.584) | .054 | ||
| UA | 0.998 (0.995 ~ 1.001) | .276 | ||
| TC | 0.926 (0.718 ~ 1.193) | .551 | ||
| TG | 0.984 (0.814 ~ 1.189) | .864 | ||
| HDLC | 1.069 (0.321 ~ 3.558) | .913 | ||
| LDLC | 0.858 (0.611 ~ 1.206) | .379 | ||
| Number of diseased coronary arteries | 2.452 (1.704 ~ 3.528) | .000 | 1.173 (0.734 ~ 1.874) | .505 |
| CAD‐RADS classification | 5.185 (3.118 ~ 8.623) | .000 | 3.383 (1.912 ~ 5.986) | .000 |
| CACS classification | 4.323 (2.633 ~ 7.100) | .000 | 2.264 (1.252 ~ 4.095) | .007 |
Abbreviations: BMI, body mass, index; CACS, coronary artery calcification score; CAD‐RADS, coronary artery disease‐reporting and data system; CI, confidence interval; NAFLD, nonalcoholic fatty liver disease; OR, odds ratio.
Figure 2.
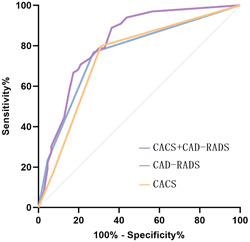
Receiver operating characteristic curve of each predictive factor. CACS, coronary artery calcification score; CAD‐RADS, coronary artery disease‐reporting and data system.
4. DISCUSSION
NAFLD is a disorder of fat metabolism. The fatty liver synthesizes and releases unsaturated fatty acids, lipid peroxide end products, and other atherogenic factors into the blood, contributing not only to the progression of fatty liver disease, but also to the development of atherosclerosis and coronary heart disease. 17 NAFLD is associated with the metabolic syndrome, which includes obesity, insulin resistance, diabetes, and dyslipidemia. 18 Studies 19 indicate that hyperglycemia, hyperlipidemia, obesity, high uric acid, and other indexes of metabolic abnormalities are risk factors for NAFLD and that high‐density lipoprotein is a protective factor. The analysis of this investigation included common relevant factors. The results showed patients with NAFLD had a higher BMI, constituent ratio of hyperglycemia and hyperlipidemia, uric acid, and triglycerides compared to patients without NAFLD, and their high‐density lipoprotein levels were lower than those of patients without NAFLD, which is consistent with the results of previous studies. Furthermore, the results of this investigation revealed that the age of patients with NAFLD was lower than that of patients without NAFLD. This may be due to the fact that as age increases, NAFLD gradually progresses to end‐stage diseases such as cirrhosis and liver cancer or the death of patients with NAFLD due to the combination of other metabolic disorders, leading to a decrease in the number of patients with NAFLD, especially when combined with hepatitis B, which worsens the disease progression.
CAD‐RADS is a standardized reporting system for patient‐specific CCTA results. Realizing the standardization of reporting is beneficial to the standardized communication between radiologists and clinicians, thereby facilitating further patient management decisions. CACS is a method proposed by Agaston to detect and analyze the burden of coronary artery calcified plaque. Ren et al. 19 , 20 found a statistical difference in CACS classification and CAD‐RADS classification between the NAFLD group and the non‐NAFLD group. Patients with NAFLD had a higher constituent ratio of CACS ≥ 100 and CAD‐RADS 3–5 categories compared to the non‐NAFLD group, which is consistent with the results of our study. This indicates that patients with NAFLD are prone to severe coronary artery lesions, and NAFLD may even promote the progression of cardiovascular diseases, 21 as confirmed by the study of Targer et al. In addition, we analyzed the constituent ratio of patients with CT‐FFR ≤ 0.80 in both groups, and the results indicated that patients with NAFLD had a higher probability of coronary artery functional ischemia.
In conclusion, we discovered that patients with NAFLD are more likely to develop cardiovascular diseases than patients without NAFLD. Rapid and accurate prediction of whether patients with NAFLD have combined coronary artery functional ischemia is of great clinical significance, as it is more beneficial in preventing or delaying the development and deterioration of coronary diseases in patients with NAFLD. Therefore, we further analyzed the predictive ability of clinical and imaging features of patients with NAFLD for coronary artery functional ischemia using noninvasive CT‐FFR technology. The incidence of coronary CT‐FFR ≤ 0.80 was associated with the number of diseased coronary arteries, CAD‐RADS classification, and CACS classification, as determined by univariate regression analysis. Additional multivariate regression analysis showed CAD‐RADS classification (adjusted OR = 3.383) and CACS classification (adjusted OR = 2.264) as independent predictive factors of the incidence of coronary artery functional ischemia. CAD‐RADS is primarily categorized based on the degree of coronary artery stenosis and plaque, and the degree of coronary artery stenosis is frequently highly correlated with the value of coronary CT‐FFR, which may be the reason why CAD‐RADS classification can predict coronary artery functional ischemia. According to the results of Detrano et al., 21 , 22 CACS can enhance the predictive value of coronary artery ischemic events. Our results also indicate a positive correlation between CACS classification and the incidence of coronary artery functional ischemia in patients with NAFLD, indicating that the coronary artery ischemia group has a higher CACS than the nonischemia group, which is consistent with other results of the study. 23 , 24 Finally, we calculated the AUC values of CACS classification, CAD‐RADS classification, and the combination of the two indexes for predicting functional coronary artery ischemia in patients with NAFLD and demonstrated that the predictive value of the combination of multiple imaging indexes was higher than that of using a single index. 25
This research has several limitations. This was a single‐center retrospective investigation, and the selection of sample size was limited to some extent. We plan to collaborate with other medical institutions to execute large‐scale prospective studies to increase the reliability of study results. In addition, the occurrence of coronary artery ischemic events may be influenced by a variety of factors, such as plaque characteristics, pericoronal fat attenuation index, and so on. We will include additional data to investigate more predictive factors for functional coronary artery ischemia in patients with NAFLD.
5. CONCLUSION
In conclusion, there were differences between patients with NAFLD and those without NAFLD. Furthermore, CAD‐RADS classification has a stronger predictive ability for coronary artery ischemia in patients with NAFLD, providing a theoretical basis for the early prevention or subsequent treatment of functional coronary artery ischemia in patients with NAFLD.
AUTHOR CONTRIBUTIONS
Conception and design of the research: Hong‐Wei Xu. Acquisition of data: Wen‐Jing Li. Analysis and interpretation of the data: Wen‐Jing Li. Statistical analysis: Wen‐Jing Li. Writing of the manuscript: Wen‐Jing Li. Critical revision of the manuscript for intellectual content: Hong‐Wei Xu. All authors read and approved the final draft.
CONFLICT OF INTEREST STATEMENT
The authors declare no conflict of interest.
ACKNOWLEDGMENTS
We would like to acknowledge the hard and dedicated work of all the staff who implemented the intervention and evaluation components of the study.
Li W‐J, Xu H‐W. The differences between patients with nonalcoholic fatty liver disease (NAFLD) and those without NAFLD, as well as predictors of functional coronary artery ischemia in patients with NAFLD. Clin Cardiol. 2024;47:e24205. 10.1002/clc.24205
DATA AVAILABILITY STATEMENT
The data sets used and/or analyzed during the current study are available from the corresponding author on reasonable request.
REFERENCES
- 1. Younossi ZM, Koenig AB, Abdelatif D, Fazel Y, Henry L, Wymer M. Global epidemiology of nonalcoholic fatty liver disease‐meta‐analytic assessment of prevalence, incidence, and outcomes. Hepatology. 2016;64(1):73‐84. 10.1002/hep.28431 [DOI] [PubMed] [Google Scholar]
- 2. Söderberg C, Stål P, Askling J, et al. Decreased survival of subjects with elevated liver function tests during a 28‐year follow‐up. Hepatology. 2010;51(2):595‐602. 10.1002/hep.23314 [DOI] [PubMed] [Google Scholar]
- 3. Lee SB, Park GM, Lee JY, et al. Association between non‐alcoholic fatty liver disease and subclinical coronary atherosclerosis: an observational cohort study. J Hepatol. 2018;68(5):1018‐1024. 10.1016/j.jhep.2017.12.012 [DOI] [PubMed] [Google Scholar]
- 4. Polyzos SA, Kechagias S, Tsochatzis EA. Review article: non‐alcoholic fatty liver disease and cardiovascular diseases: associations and treatment considerations. Aliment Pharmacol Ther. 2021;54(8):1013‐1025. 10.1111/apt.16575 [DOI] [PubMed] [Google Scholar]
- 5. Xia YM, Gao H, Wang QS, Feng X, Wang YQ, Xu ZX. Characteristics of traditional Chinese medicine syndrome in patients with coronary heart disease at different disease stages. World J Tradit Chin Med. 2022;8:218‐224. 10.4103/wjtcm.wjtcm_65_21 [DOI] [Google Scholar]
- 6. Duell PB, Welty FK, Miller M, et al. American Heart Association Council on Arteriosclerosis, Thrombosis and Vascular Biology; Council on Hypertension; Council on the Kidney in Cardiovascular Disease; Council on Lifestyle and Cardiometabolic Health; and Council on Peripheral Vascular Disease . Nonalcoholic fatty liver disease and cardiovascular risk: a scientific statement from the American heart association. Arterioscler Thromb Vasc Biol. 2022;42(6):e168‐e185. 10.1161/ATV.0000000000000153 [DOI] [PubMed] [Google Scholar]
- 7. Vita T, Murphy DJ, Osborne MT, et al. Association between nonalcoholic fatty liver disease at CT and coronary microvascular dysfunction at myocardial perfusion PET/CT. Radiology. 2019;291(2):330‐337. 10.1148/radiol.2019181793 [DOI] [PMC free article] [PubMed] [Google Scholar]
- 8. Cury RC, Abbara S, Achenbach S, et al. CAD‐RADS(TM) coronary artery disease—reporting and data system. An expert consensus document of the Society of Cardiovascular Computed Tomography (SCCT), the American College of Radiology (ACR) and the North American Society for Cardiovascular Imaging (NASCI). Endorsed by the American College of Cardiology. J Cardiovasc Comput Tomogr. 2016;10(4):269‐281. 10.1016/j.jcct.2016.04.005 [DOI] [PubMed] [Google Scholar]
- 9. Xie JX, Cury RC, Leipsic J, et al. The coronary artery disease–reporting and data system (CAD‐RADS). JACC: Cardiovasc Imaging. 2018;11(1):78‐89. 10.1016/j.jcmg.2017.08.026 [DOI] [PubMed] [Google Scholar]
- 10. Nam K, Hur J, Han K, et al. Prognostic value of coronary artery disease‐reporting and data system (CAD‐RADS) score for cardiovascular events in ischemic stroke. Atherosclerosis. 2019;287:1‐7. 10.1016/j.atherosclerosis.2019.05.022 [DOI] [PubMed] [Google Scholar]
- 11. Koo BK, Erglis A, Doh JH, et al. Diagnosis of ischemia‐causing coronary stenoses by noninvasive fractional flow reserve computed from coronary computed tomographic angiograms. Results from the prospective multicenter DISCOVER‐FLOW (Diagnosis of Ischemia‐Causing Stenoses Obtained Via Noninvasive Fractional Flow Reserve) study. J Am Coll Cardiol. 2011;58(19):1989‐1997. 10.1016/j.jacc.2011.06.066 [DOI] [PubMed] [Google Scholar]
- 12. Nørgaard BL, Leipsic J, Gaur S, et al. NXT Trial Study Group . Diagnostic performance of noninvasive fractional flow reserve derived from coronary computed tomography angiography in suspected coronary artery disease. J Am Coll Cardiol. 2014;63(12):1145‐1155. 10.1016/j.jacc.2013.11.043 [DOI] [PubMed] [Google Scholar]
- 13. Tang CX, Wang YN, Zhou F, et al. Diagnostic performance of fractional flow reserve derived from coronary CT angiography for detection of lesion‐specific ischemia: a multi‐center study and meta‐analysis. Eur J Radiol. 2019;116:90‐97. 10.1016/j.ejrad.2019.04.011 [DOI] [PubMed] [Google Scholar]
- 14. Chhabra R, O'Keefe JH, Patil H, et al. Association of coronary artery calcification with hepatic steatosis in asymptomatic individuals. Mayo Clin Proc. 2013;88(11):1259‐1265. 10.1016/j.mayocp.2013.06.025 [DOI] [PubMed] [Google Scholar]
- 15. Puchner SB, Lu MT, Mayrhofer T, et al. High‐risk coronary plaque at coronary CT angiography is associated with nonalcoholic fatty liver disease, independent of coronary plaque and stenosis burden: results from the ROMICAT II trial. Radiology. 2015;274(3):693‐701. 10.1148/radiol.14140933 [DOI] [PMC free article] [PubMed] [Google Scholar]
- 16. Patsouras A, Farmaki P, Garmpi A, et al. Screening and risk assessment of coronary artery disease in patients with type 2 diabetes: an updated review. In Vivo. 2019;33(4):1039‐1049. 10.21873/invivo.11572 [DOI] [PMC free article] [PubMed] [Google Scholar]
- 17. Liu J, Fox CS, Hickson D, Bidulescu A, Carr JJ, Taylor HA. Fatty liver, abdominal visceral fat, and cardiometabolic risk factors: the Jackson Heart Study. Arterioscler Thromb Vasc Biol. 2011;31(11):2715‐2722. 10.1161/ATVBAHA.111.234062 [DOI] [PMC free article] [PubMed] [Google Scholar]
- 18. Cai J, Zhang XJ, Li H. Progress and challenges in the prevention and control of nonalcoholic fatty liver disease. Med Res Rev. 2019;39(1):328‐348. 10.1002/med.21515 [DOI] [PubMed] [Google Scholar]
- 19. Ren Z, Wen D, Xue R, et al. Nonalcoholic fatty liver disease is associated with myocardial ischemia by CT myocardial perfusion imaging, independent of clinical and coronary CT angiography characteristics. Eur Radiol. 2023;33(6):3857‐3866. 10.1007/s00330-022-09306-0 [DOI] [PubMed] [Google Scholar]
- 20. Targher G, Tilg H, Byrne CD. Non‐alcoholic fatty liver disease: a multisystem disease requiring a multidisciplinary and holistic approach. Lancet Gastroenterol Hepatol. 2021;6(7):578‐588. 10.1016/S2468-1253(21)00020-0 [DOI] [PubMed] [Google Scholar]
- 21. Detrano R, Guerci AD, Carr JJ, et al. Coronary calcium as a predictor of coronary events in four racial or ethnic groups. N Engl J Med. 2008;358(13):1336‐1345. 10.1056/NEJMoa072100 [DOI] [PubMed] [Google Scholar]
- 22. Nørgaard BL, Gaur S, Leipsic J, et al. Influence of coronary calcification on the diagnostic performance of CT angiography derived FFR in coronary artery disease. JACC: Cardiovasc Imaging. 2015;8(9):1045‐1055. 10.1016/j.jcmg.2015.06.003 [DOI] [PubMed] [Google Scholar]
- 23. Di Jiang M, Zhang XL, Liu H, et al. The effect of coronary calcification on diagnostic performance of machine learning‐based CT‐FFR: a Chinese multicenter study. Eur Radiol. 2021;31(3):1482‐1493. 10.1007/s00330-020-07261-2 [DOI] [PubMed] [Google Scholar]
- 24. Esenboğa K, Kurtul A, Nazman H, et al. Evaluation of the impact of ranolazine treatment on liver function tests in patients with coronary heart disease and nonalcoholic fatty liver disease. Angiology. 2022;73(1):73‐78. 10.1177/00033197211005590 [DOI] [PubMed] [Google Scholar]
- 25. Huang J, Li M, Zhoua WJ, et al. Integrated miRNA and mRNA analysis identified potential mechanisms and targets of qianggan extracts in preventing nonalcoholic steatohepatitis. World J Tradit Chin Med. 2022;8:77‐86. 10.4103/wjtcm.wjtcm_48_21 [DOI] [Google Scholar]
Associated Data
This section collects any data citations, data availability statements, or supplementary materials included in this article.
Data Availability Statement
The data sets used and/or analyzed during the current study are available from the corresponding author on reasonable request.