
Figure 6.
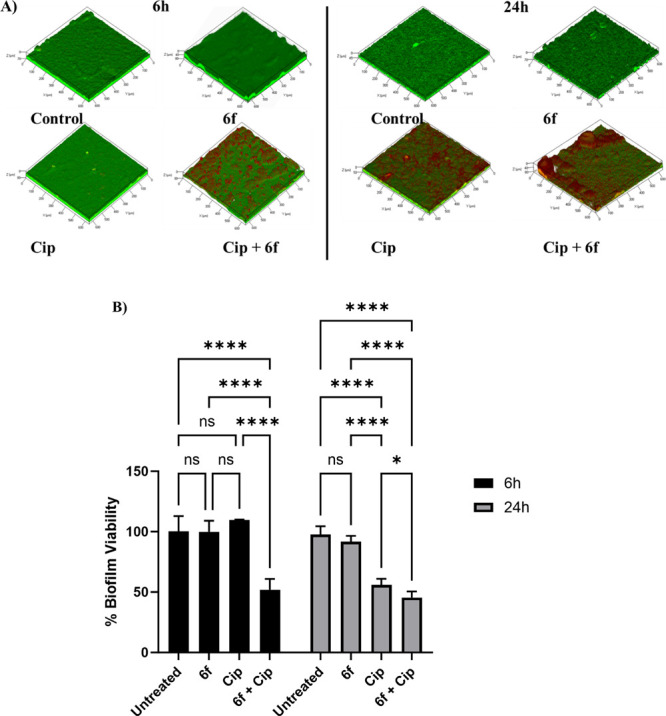
(A) Representative CLSM 3D Z-stack images of PAO1-L biofilms after 24 h growth with or without 6f and further treatment for 6 or 24 h with no treatment (control), 6f (10 μM), ciprofloxacin (Cip: 60 μg/mL), or a combination of 6f and Cip (10 μM and 60 μg/mL, respectively). Live bacteria are depicted in green (SYTO9 dye) and dead cells are shown in red color (propidium iodide stain). (B) Biofilm viability assay. Bar chart showing PAO1-L biofilm viability quantified after treatment with different conditions for 6 or 24 h. The concentrations of the drugs used were ciprofloxacin 60 μg/mL (Cip) and 6f, 10 μM. The statistical analysis was performed using 2-way ANOVA analysis (GraphPad 9.0).