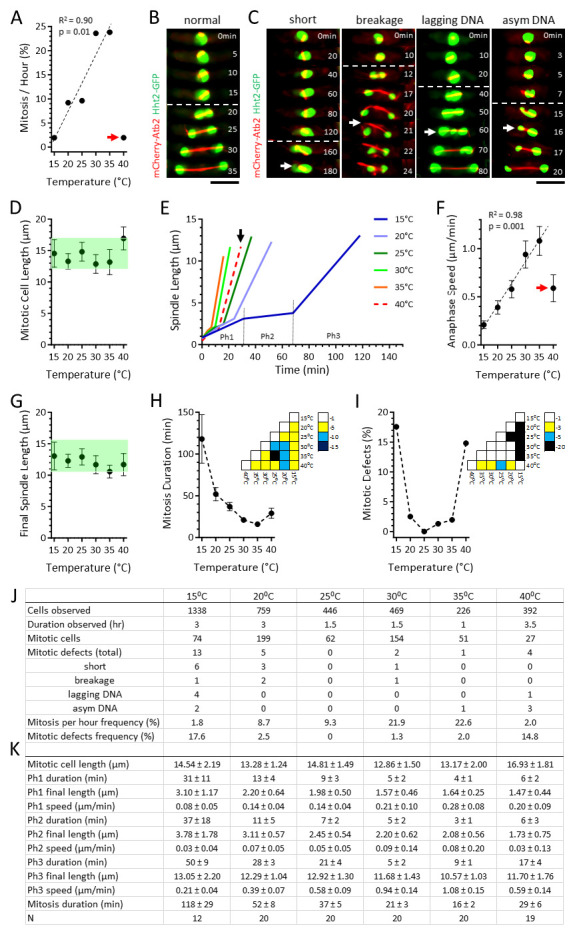
Figure 1. Fission yeast spindle dynamics and chromosome segregation fidelity follow distinct temperature-dependent U-shaped curves .

A. Plot of the observed frequency of mitotic cells per hour versus temperature. From 15⁰C to 35⁰C the mitotic frequency positively correlates with increasing temperature. However, at 40⁰C the mitotic frequency decreases dramatically (red arrow). Regression analysis coefficient of determination R 2 and p-value are shown.
B. A ‘normal’ mitotic cell. Time-lapsed images of a wild-type cell expressing mCherry- Atb2 (tubulin) and Hht2 -GFP (histone) undergoing mitosis at 25⁰C. White dashed line delineates the start of anaphase B, where sister chromosomes are separated to the pole as the spindle dramatically elongates. Spindle assembly and elongation correspond to the typical error-free symmetrical chromosome segregation, where equal chromosome masses are present in daughter cells. Scale bar, 5 μm.
C. Representative defective mitotic cells: ‘short’ highlights a 15⁰C spindle that failed to elongate over an abnormally long period of time (white arrow, 180 min time point); ‘breakage’ highlights a 30⁰C spindle that buckled and broke (white arrow, 21 min time point), resulting in defective chromosome positioning; ‘lagging DNA’ highlights a 15⁰C spindle exhibiting chromosome lagging during anaphase, resulting in defective chromosome segregation (white arrow, 60 min time point); ‘asym DNA’ highlights a 35⁰C spindle exhibiting asymmetric or unequal chromosome mass separation at anaphase, resulting in daughter cells with abnormal DNA content. White dashed line delineates the start of anaphase B. Scale bar, 5 μm.
D. Plot of mitotic cell length versus temperature. Shown are mean ± standard deviation. Green shade highlights similarity among the values, except at 40⁰C.
E. Plot of spindle length versus time. Shown are mean spindle length at respective temperature. Spindle dynamics follow the typical 3-phase kinetics. Representative phases are shown for 15⁰C: Ph1, prophase; Ph2, metaphase-anaphase A; and Ph3, anaphase B. Note that spindle dynamics trend progressively faster with increasing temperature, except at 40⁰C (black arrow).
F. Plot of anaphase elongation speed versus temperature. Shown are mean ± standard deviation. From 15⁰C to 35⁰C the speed positively correlates with increasing temperature. However, at 40⁰C the speed decreases dramatically (red arrow). Regression analysis coefficient of determination R 2 and p-value are shown.
G. Plot of final spindle length versus temperature. Shown are mean ± standard deviation. Green shade highlights similarity among the values.
H. Plot of mitotic duration versus temperature. Shown are mean ± standard deviation. Dashed line highlights trend of the values. (Inset) p-values obtained using the t-test across temperatures. The color bar indicates the scale of p-values, represented as powers of 10.
I. Plot of frequency of spindle defects (cumulative sum of different defects shown in Fig. 1B) versus temperature. Dashed line highlights trend of the values. (Inset) p-values obtained using the ꭓ 2 -test across temperatures. The color bar indicates the scale of p-values, represented as powers of 10.
J. Table of cumulative observed cells, mitotic cells, and mitotic defects at different temperatures. Mitosis per hour frequency is calculated as % = Mitotic cells/Cells observed/Duration observed. Mitotic defects frequency was calculated as % = Mitotic defects/Mitotic cells.
K. Table of the 3-phase spindle dynamic parameters at different temperatures. Ph1, prophase; Ph2, metaphase-anaphase A; Ph3, anaphase B. Shown are mean ± standard deviation.
