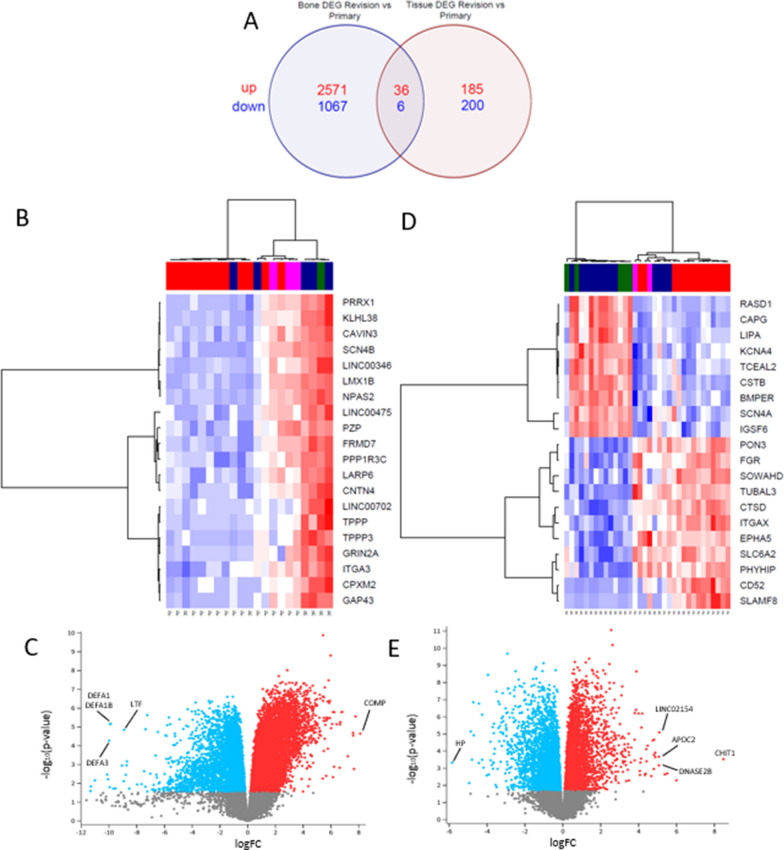
Fig. 2.
A Venn Diagram depicting number of differentially expressed genes in bone and tissue and the number of overlapping genes, up-expressed genes are in red and down-expressed genes in blue; DEG – differentially expressed genes. B Heatmap of the top 20 differentially expressed genes in bone samples with logFC >|2.0| ranked by adj-P value. C Volcano plot of differentially expressed genes in bone samples. D Heatmap of top 80 differentially expressed genes in tissue samples with logFC >|2.0| ranked by adj-P value. E Volcano plot of differentially expressed genes in tissue samples, the top three up or down-expressed mRNA genes are labelled

