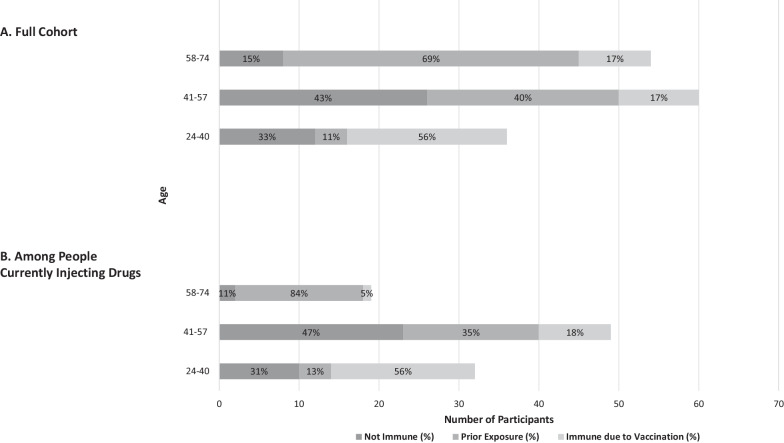
Fig. 1.
HBV Exposure Status by Age in A Full Cohort (N = 150), and B People Currently Injecting Drugs (n = 100). A Distribution of HBV exposure status by the three age categories, in the full cohort by number of participants in each category. B A subset of the cohort who self-reported current IDU. Distribution signifies HBV exposure status rates in subset for the three age categories. Number of participants in each category is signified by y-axis, this number as a percent of the cohort and subset, age category, is contained in each bar

