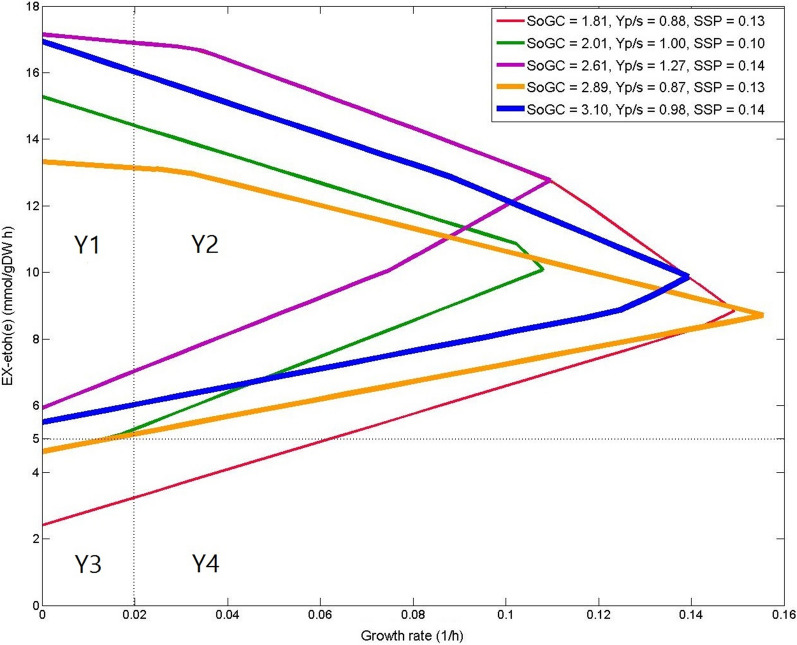
Fig. 3.
Five exemplar production envelopes for strategies identified by FastKnock for ethanol production in iAF1260, which is partitioned into four regions based on the growth rate (x axis) and the production flux (y axis) as in [15]. The horizontal dashed line indicates the threshold for production rate as considered in [15], and the vertical dashed line indicates the growth rate threshold. SoGC(× 100), product yield (Yp/s) and SSP(× 10) of the quadruple knockout strategies are shown in the top right legend. Unlike FastKnock, MCSEnumerator finds none of these strategies except the one shown in blue

