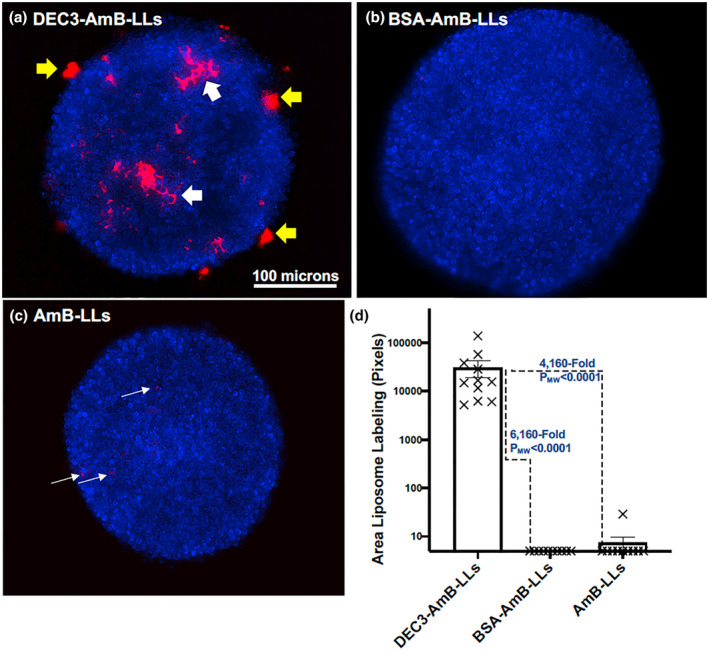
FIGURE 7.

DEC3‐AmB‐LLs bound efficiently to large Cryptococcus neoformans colonies. (a–c) respectively, show representative photographic images of red fluorescent DEC3‐AmB‐LLs, BSA‐AmB‐LLs, and AmB‐LLs binding to CW‐stained 18‐hr‐old colonies of C. neoformans grown on an agar surface. Yellow arrows indicate DEC3‐AmB‐LL binding to EPS deposits, and large white arrows indicate binding that surrounds spherical yeast cells within the colonies. The scale bar indicates the size of the colonies photographed at 20× magnification. The uncommon red fluorescence of control liposome binding (white thin arrows in c) had to be greatly enhanced relative to that for DEC3‐AmB‐LLs to make it visible for presentation. (d) The relative area of red fluorescent liposome binding (log10) was quantified using AreaPipe and is shown in a scatter bar plot. N = 11 for each bar. Standard errors from the mean and PMW values are indicated.
