
FIGURE 3.
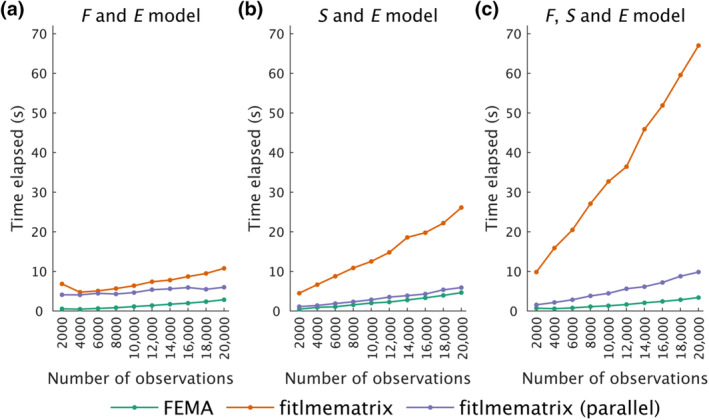
Comparison of time taken to fit different models using FEMA (green), fitlmematrix in MATLAB (orange), and implementation of fitlmematrix using parallel computing (purple) as a function of increasing number of observations for 50 imaging variables and five fixed effects. The random effects included in each model are indicated at the top of each panel: family effect , subject effect , and the unmodeled variance term .