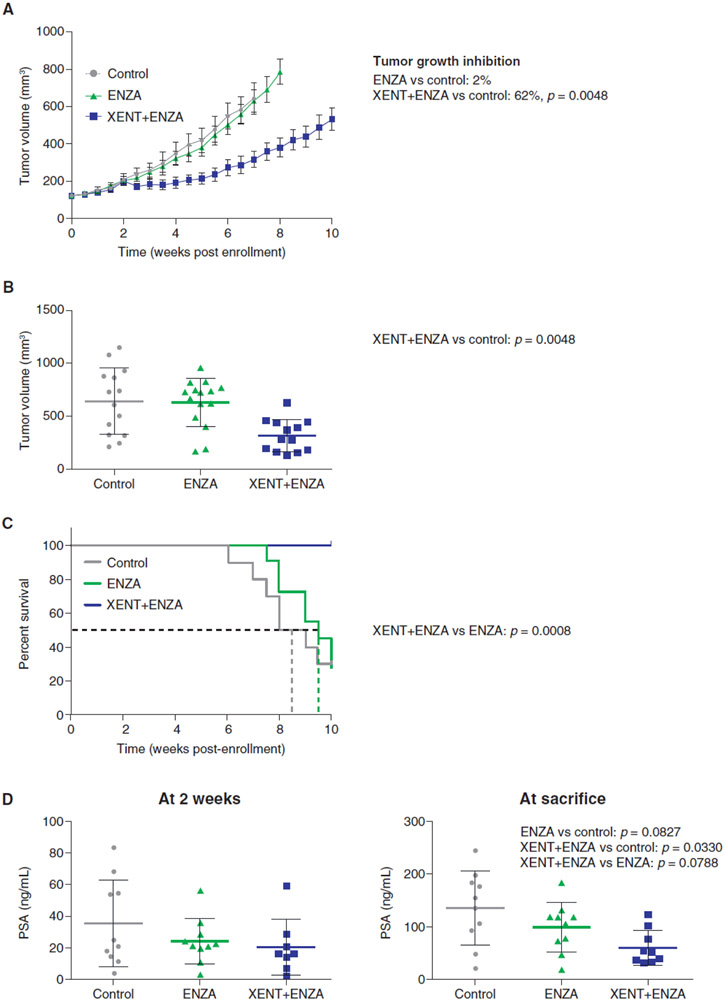
Figure 5.
In vivo tumor responses, survival, and PSA in LuCaP 96CR PDX. Fox Chase CB17 SCID male mice were castrated and were implanted with LuCaP 96CR tumor fragments 2 weeks later. Once tumor volumes exceeded 101 mm3, animals were randomized to receive Natrosol™ vehicle control [p.o.; n = 15], ENZA (30 mg/kg p.o.; 5 days on, 2 days off, for 10 cycles; n = 15), or ENZA (dosing regimen as previously noted) plus XENT [200 mg/kg i.p., once weekly for 10 cycles; n = 14]. A) Change in tumor volume with time by treatment group; adjusted P values were calculated 7 weeks after start of treatment. B) Dot plot of tumor volumes in individual animals, by treatment group, 7 weeks after start of treatment. C) Survival by treatment group. D) Individual serum PSA levels, at 2 weeks of treatment, and at sacrifice. P values were calculated using one-sided decreasing Mann–Whitney tests (adjusted according to Bonferroni–Holm).

