Figure 6.
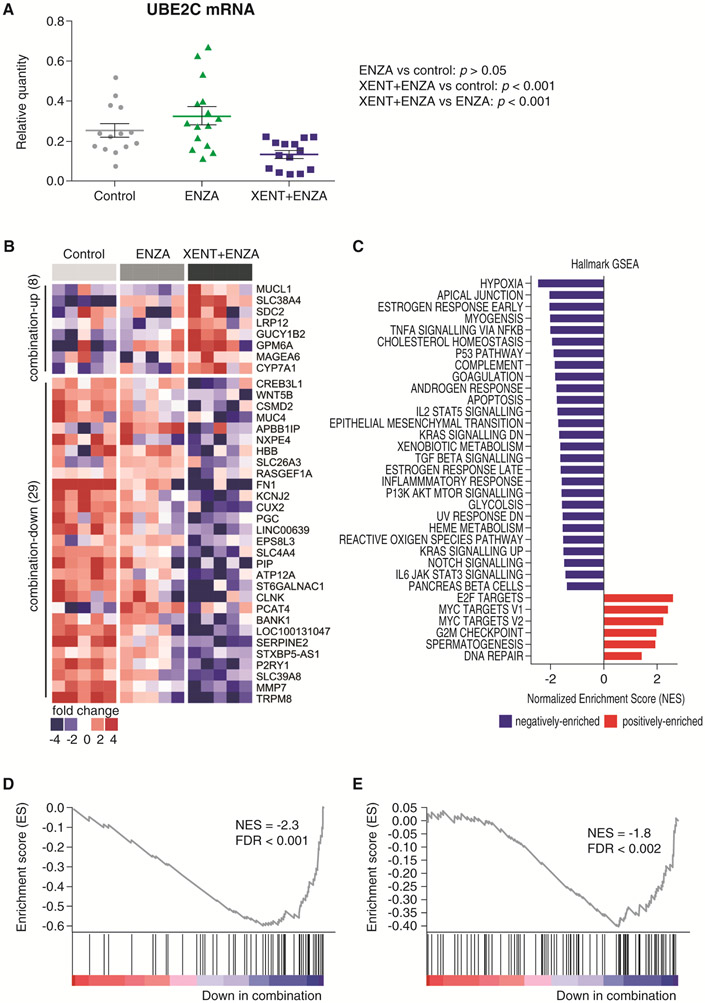
Expression of the AR-V7 target gene UBE2C and RNA-Seq/GSEA in LuCaP 96CR PDX. A) qPCR analysis of UBE2C mRNA. B) Heat map of RNA-Seq data comparing vehicle control, ENZA, and the combination of XENT and ENZA for genes with P < 0.05 and fold change ≥ 3. C) GSEA results of all Hallmark pathways with FDR < 0.05. D) GSEA plot of HIF1 pathway. E) GSEA plot of androgen response genes. P values were calculated using Tukey tests conducted following a one-way analysis of variance.

