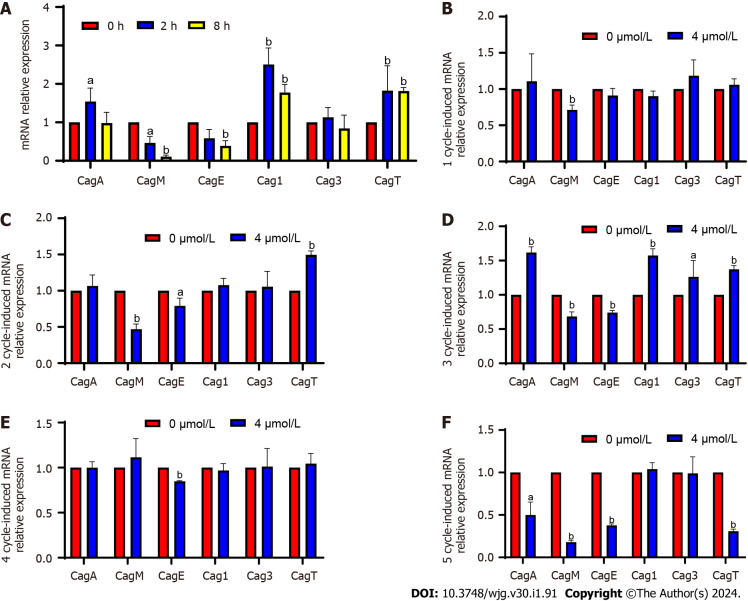
Figure 3.
Verification of differentially expressed genes and changes in screened differentially expressed genes following induction. A: Quantitative PCR verification of differentially expressed genes (DEGs); B-F: Changes in DEGs after induction with 4 μmol/L sodium selenite for 1-5 cycles. aP < 0.05; bP < 0.01.

