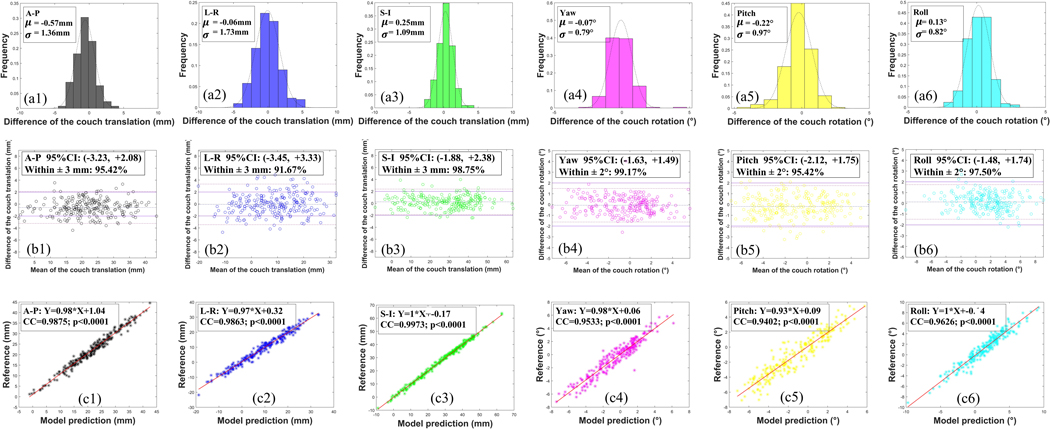
Figure 4.
Analysis of the difference of couch shifts between the model prediction and the reference on the 240 CBCT scans of different treatment fractions of six patients. The first row shows the histograms of the difference. The second row shows the Bland-Altman analysis with the predefined clinically accepted tolerance (solid line) and the 95% confidence interval (dot-dash line). The third row shows the CC. (1–6) show the results in the direction of A-P, L-R, S-I, yaw, pitch, and roll, respectively. Abbreviation: A-P = anterior-posterior, L-R = left-right, S-I = superior-inferior.

