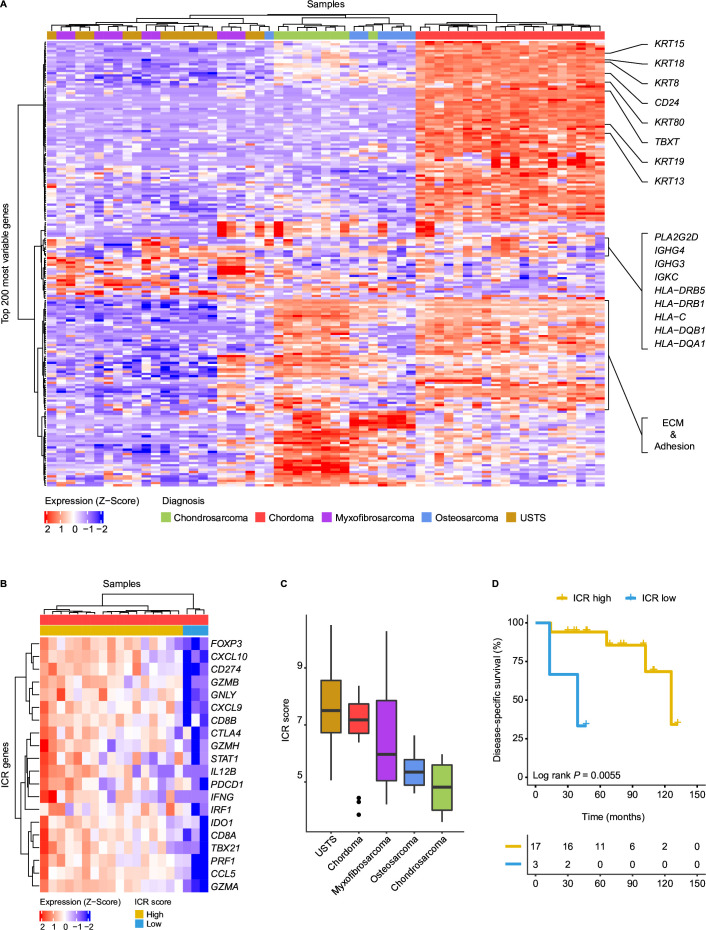
Figure 1.
Chordomas display hallmarks of antitumor immunity. (A) Heatmap demonstrating the log2 normalized gene expression Z-score of the top 200 most variably expressed genes in all sarcoma samples (n=59). Samples are annotated according to their histotype. Genes associated with chordoma samples are highlighted on the right. These genes include chordoma-specific genes such as TBXT, CD24 and several keratins. In addition, immune-related genes are highlighted, including human leukocyte antigen (HLA*) and immunoglobulin (IG*) genes. (B) Heatmap presenting the Z-score for the log2 normalized expression of the 20 ICR signature genes in 20 chordoma samples. Based on the expression Z-score, the samples are classified into two groups through unsupervised hierarchical clustering: ICR high (n=17) and ICR low (n=3). (C) Boxplots presenting the immunologic constant of rejection (ICR) score per sarcoma subtype in descending order. (D) Kaplan-Meier curves displaying disease-specific survival for the ICR high and ICR low chordomas. Two-sided log-rank tests were performed for the Kaplan-Meier estimates. ECM, extracellular matrix; USTS, undifferentiated soft tissue sarcoma.

