Figure 2.
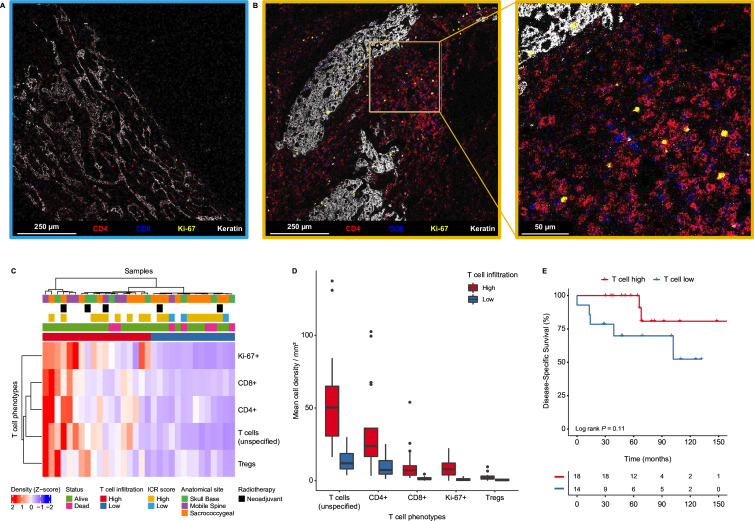
Chordomas present distinct groups based on T cell infiltration. (A–B) Heterogeneity in T cell infiltration in chordomas. The images show T cell-related markers (CD4=red, CD8=blue), a proliferation marker (Ki-67=yellow) and a tumor marker (keratin=white) as detected by imaging mass cytometry. (A) chordoma with low T cell infiltration (ICR low). (B) Chordoma with high T cell infiltration and a magnified image of the chordoma with high T cell infiltration (ICR high). (C) Heatmap showing the mean cell density Z-score of all T cell phenotypes in all chordoma samples (n=32), hierarchically clustered into a T cell high (n=18) and T cell low (n=14) group. Samples are annotated with their respective ICR score from the transcriptional analysis. In addition, the samples are annotated for their anatomical location, the follow-up status of the patients as well as whether the sample had received neoadjuvant radiotherapy. (D) Boxplots presenting the mean cell densities per mm2 per classified T cell group (T cell high: n=18; T cell low: n=14) for the identified T cell phenotypes. (E) Kaplan-Meier curves interrogating the association between T cell infiltration and disease-specific survival. Two-sided log-rank tests were performed for the Kaplan-Meier estimates. ICR, immunologic constant of rejection; Tregs, regulatory T cells.

