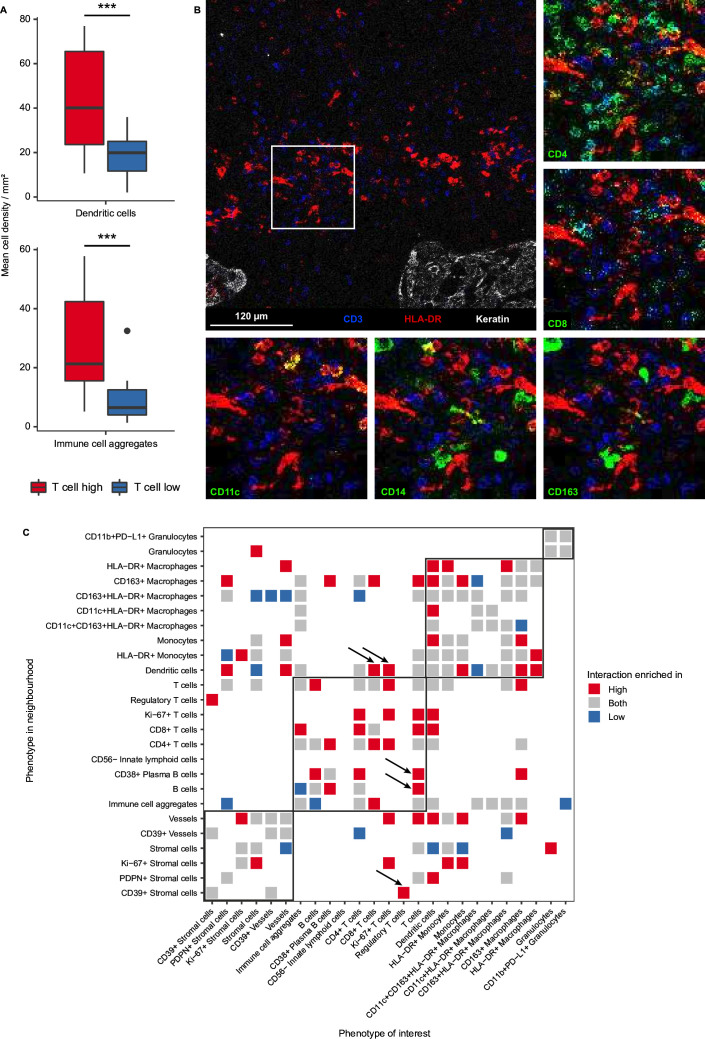
Figure 3.
Pro-inflammatory interactions shape the immune microenvironment of T cell high chordomas. (A) Boxplots comparing cell densities between the T cell high (n=18) and T cell low groups (n=14). Dendritic cells (CD11c+/−HLA-DR+CD68−) and immune cell aggregates (CD45+ and multiple differentiation markers, eg, CD3+CD68+) are significantly higher in the T cell high group as compared with the T cell low group. Two-sided t-test was performed in R and the p value was adjusted with the Benjamini-Hochberg false discovery rate. *=p<0.05; **=p<0.01; ***p<0.001. (B) An image generated with imaging mass cytometry displaying co-localization of dendritic cells (HLA-DR=red) and T cells (CD3=blue). Tumor cells are only shown in the overview image (top-left image, keratin=white). Other myeloid and T cell-related markers are presented in separate images around the overview image in green (CD4, CD8, CD11c, CD14 and CD163), to show co-localization of different markers. (C) Heatmap displaying the spatial interaction analysis results comparing the microenvironment of T cell high with T cell low chordomas. Only significant interactions are visualized and colored for the subgroup(s) in which they are enriched. Permutation Z-scores below 10 were considered not significant and thus removed for visualization. Interactions of interest are indicated by black arrows. PD-L1, programmed death-ligand 1; PDPN, podoplanin.

