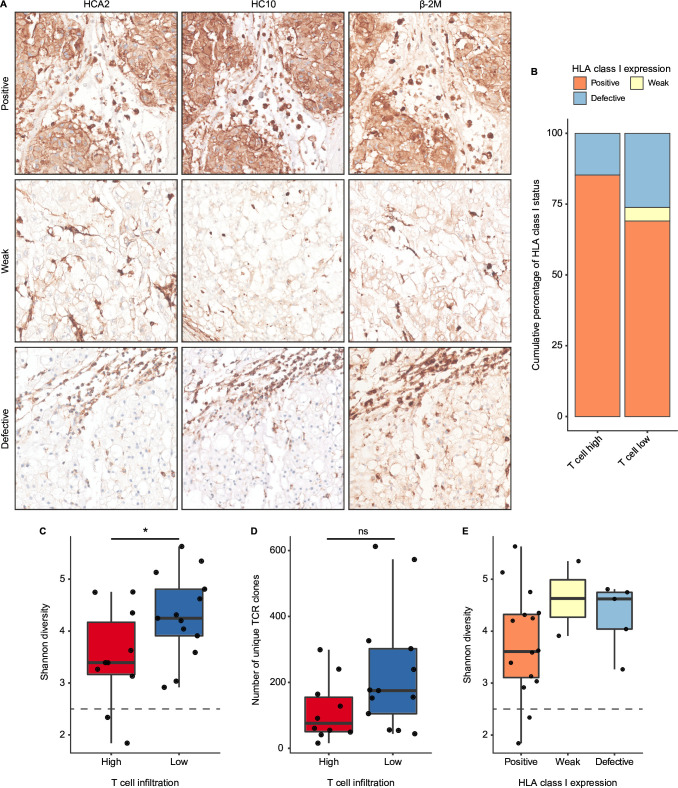
Figure 5.
Antigen presentation and T cell clonal enrichment are present in chordomas. (A) Human leukocyte antigen (HLA) class I (HCA2 and HC10) and β−2m expression patterns as validated by immunohistochemistry presenting the distinct expression patterns. From top to bottom, these images display positive expression of HLA class I and thus also β−2m, weak expression of HLA class I and β−2m and defective expression of HLA class I accompanied by weak expression of β−2m. (B) Stacked bar plots displaying the percentual distribution of the observed HLA class I (both HCA2 and HC10) expression patterns in the chordoma samples in both T cell groups (T cell high: n=34; T cell low: n=40). (C, D) Boxplots displaying the Shannon diversity (C) and the number of unique clones (D) of the profiled T cell receptors (TCR) from the immune microenvironment of chordomas (n=23). Both the Shannon diversity and the number of unique clones are compared between the T cell high (n=10) and the T cell low (n=13) groups. Two-sided t-tests were performed to compare the T cell high and the T cell low group. *=p<0.05; ns=not significant (p>0.05). (E) Boxplots presenting the Shannon diversity in relation to the observed HLA class I expression patterns in the subset that underwent TCR profiling (n=22).

