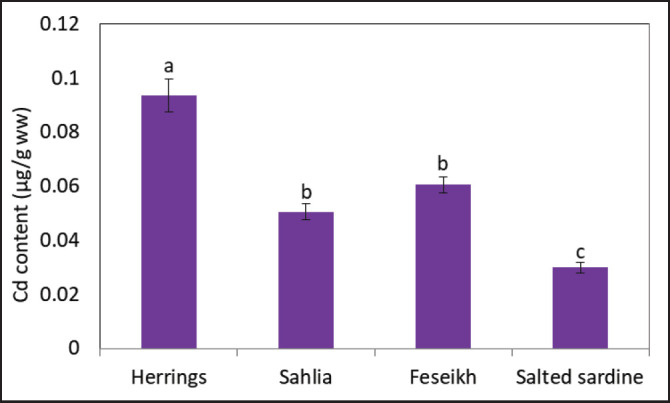
Fig. 2. Shows the residual cadmium (Cd) content (µg/g ww) in the salted fish that was tested. Means ± standard error are shown for each variety of salted fish (n = 20). At p < 0.05, there is a substantial difference between columns that carry different letters.

