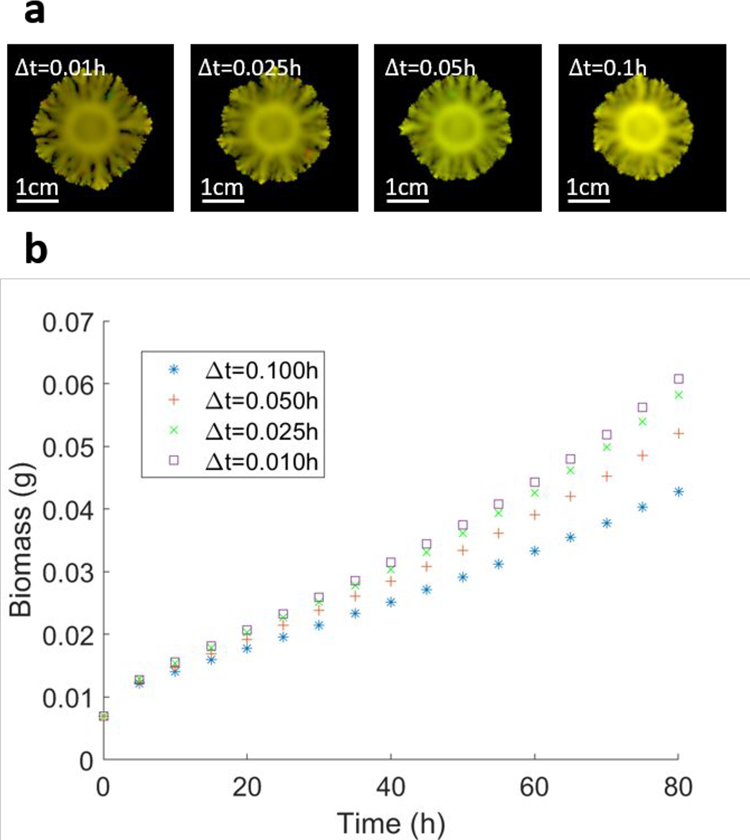
Extended Data Figure 1.
Sensitivity of the simulation results depending on the value of the finite time step. Starting with a simulation identical to the one in Procedure 7, we repeated it with four different values of the time step: a) images of the final colony morphologies, b) plot of the total biomass change with time, illustrating the magnitude of the error due to the finite time step size. The simulation time step size should be chosen such that final simulation result is within the tolerated error.

