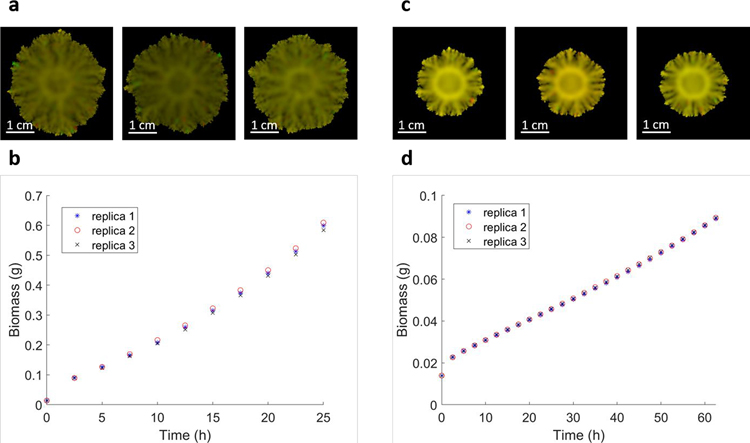
Extended Data Figure 3.
Sensitivity of the simulation results depending on the value of the amplitude of the demographic noise. Starting with a simulation identical to the one in Procedure 7, we repeated it with two different magnitudes of the noise amplitude : a) images of three replicas of a colony simulation and b) plot of the total biomass change with time of the three replicas simulations with ; c) images of three replicas of a colony simulation and d) plot of the total biomass change with time of the three replicas simulations with . A finalized result of a simulation study in presence of noise should be averaged over several replicas of the stochastic simulation. The change of the noise amplitude however may have a significant effect of the growth rate and the final morphology. The value of the noise amplitude should be chosen to best represent an experimental result.

