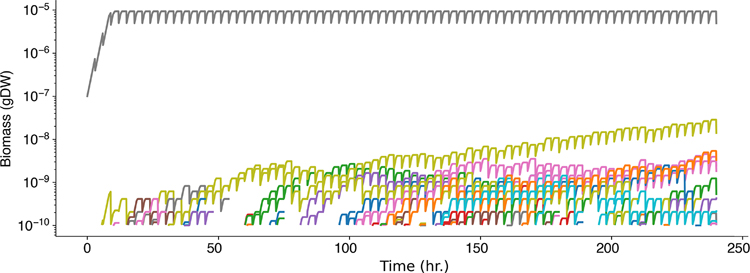
Figure 7. Simulation of evolutionary processes.
In this simulation exemplifying an evolutionary process (Procedure 5), an Escherichia coli model was seeded in 1μL of glucose minimal medium (0.1mM) and transferred every 3 hours to a fresh medium using a dilution factor of 1:2 during 10 days. Mutations (in the form of reaction knock-outs) were allowed to happen in this population at a rate of 10−8 knock-outs appearing per gene and generation. The gray line represents the ancestor, which remains at high density, and other colors are used to represent different mutations that appear, persist during variable periods and extinguish stochastically.

