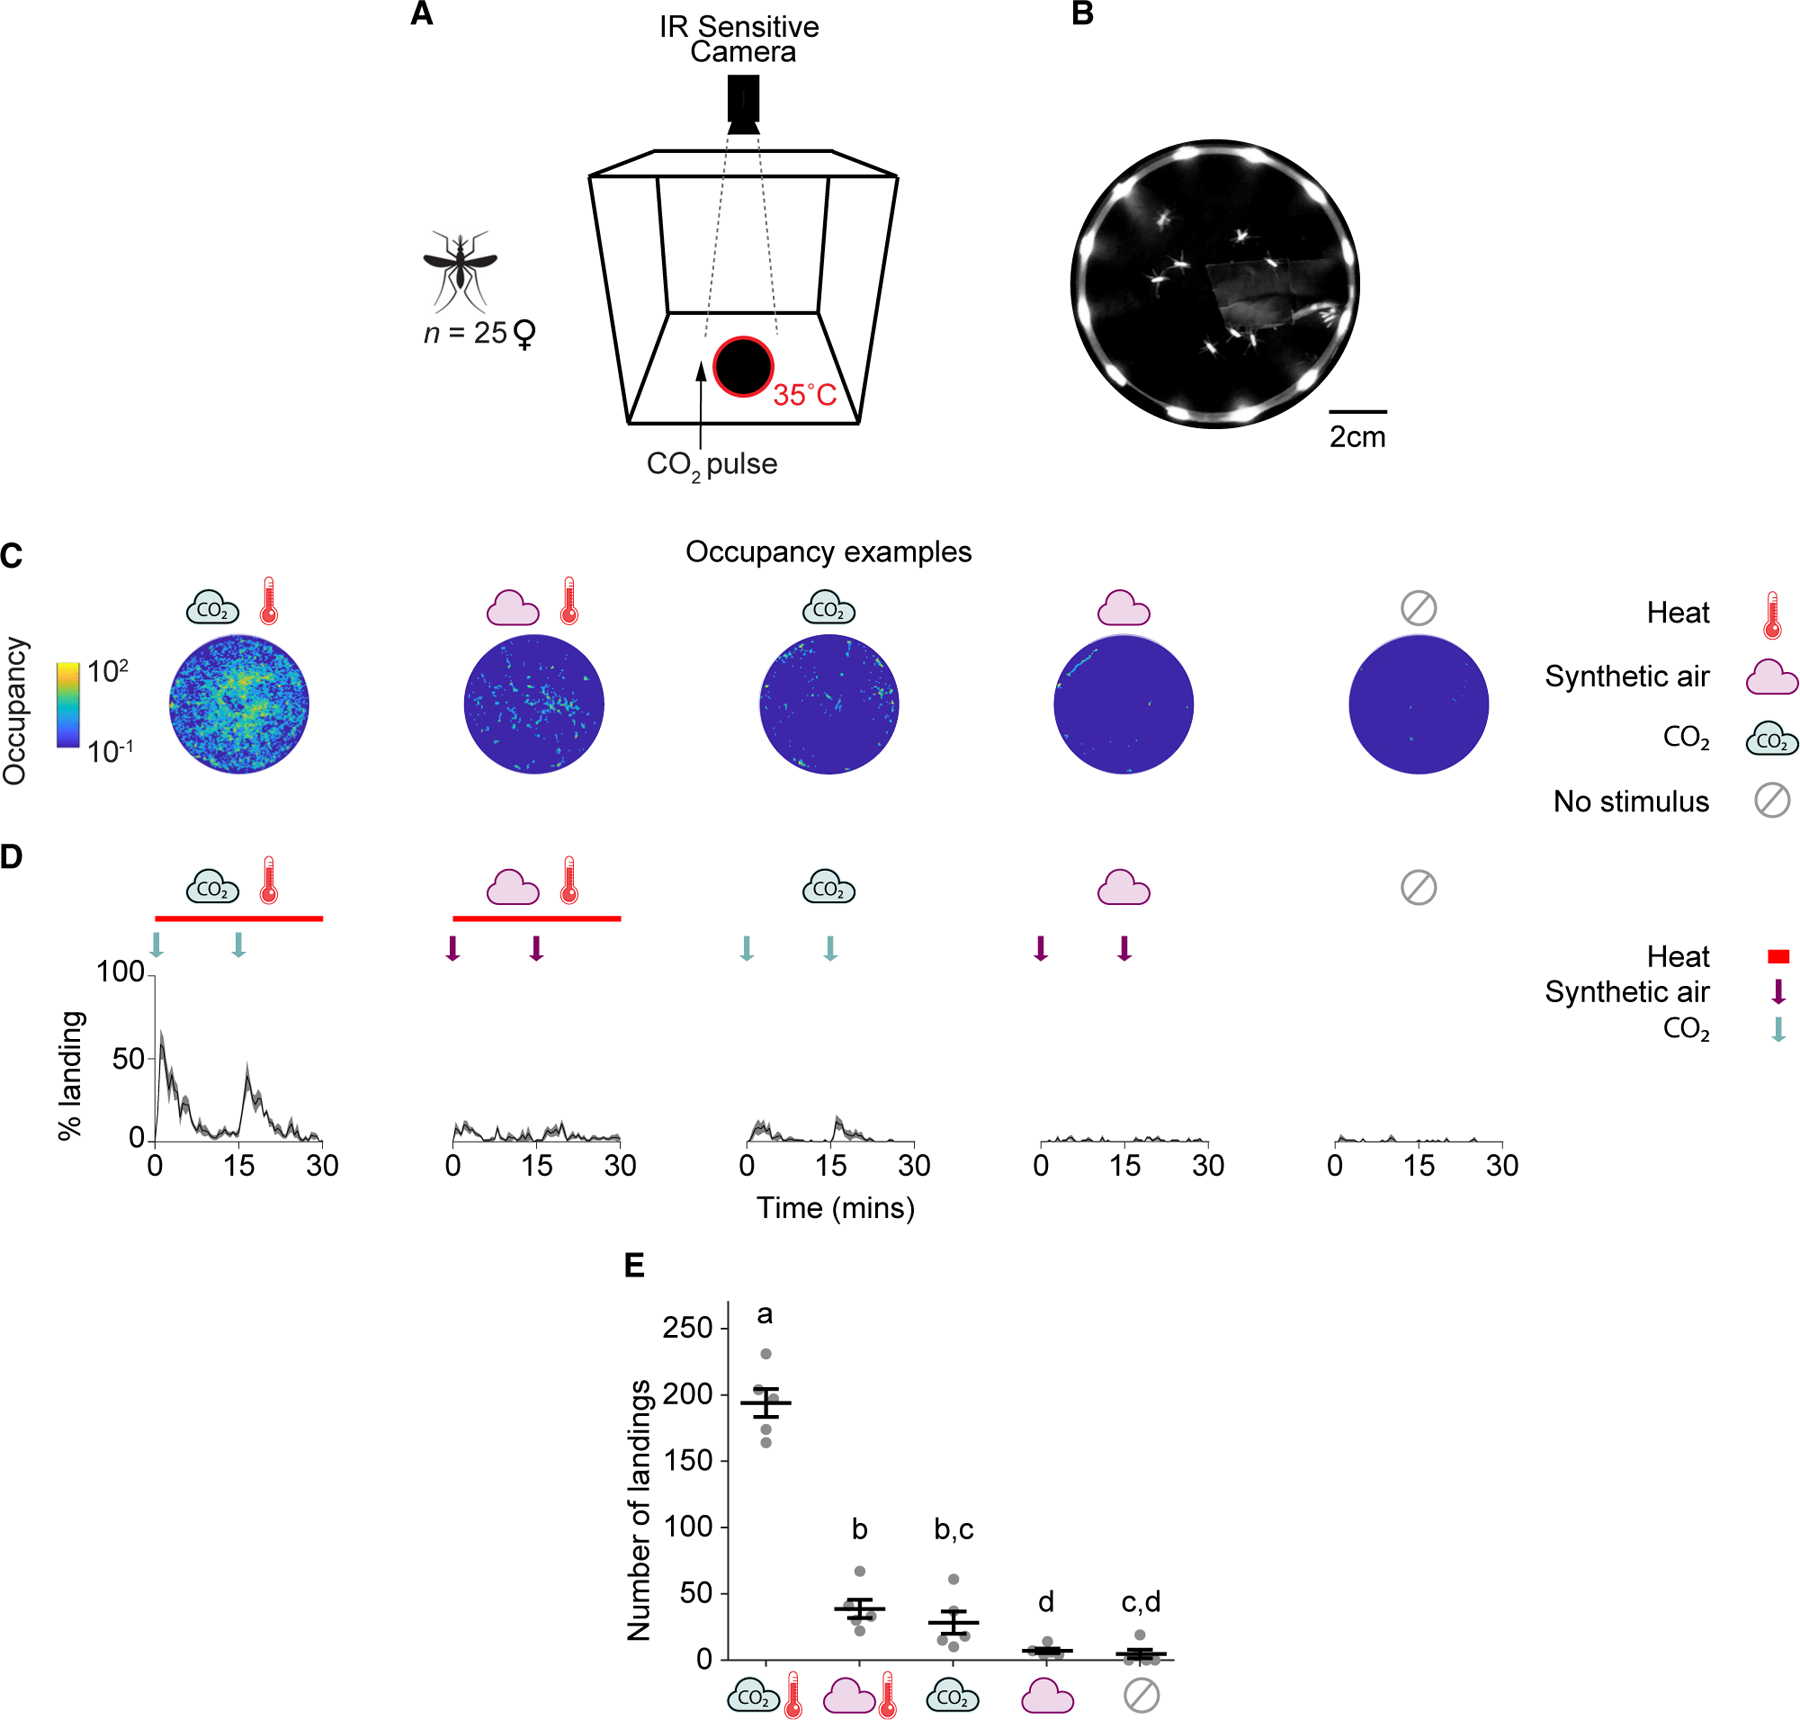
Figure 1. OGTA for measuring Anopheles gambiae landing behavior at night.

(A) Schematic of the odor-guided thermotaxis assay (OGTA) for use in laboratory conditions. An. gambiae females (n = 25 per trial) were introduced into a cage containing a heated landing platform surrounded by infrared LEDs. CO2 was puffed into the cage at t = 0 min and t = 15 min adjacent to the landing platform (arrow, 1 min per pulse) and mosquito landings were recorded.
(B) Example image frame of mosquitoes landing on the heated platform illuminated by the surrounding infrared light array.
(C) Heatmaps of platform occupancy from a representative experiment for each stimulus combination.
(D) Percentage of mosquitoes landing on the platform throughout the experiment for each stimulus combination. The arrows indicate the time points of stimulus onset. Bars represent the length of the heat stimulus duration. Mean ± SEM plotted.
(E) Total number of landings on the platform for each stimulus combination. Mean ± SEM plotted. n = 5/stimulus combination. The letters indicate significant differences (p < 0.05): Fisher’s exact permutation tests with Benjamini-Hochberg correction.
See also Data S1A.
