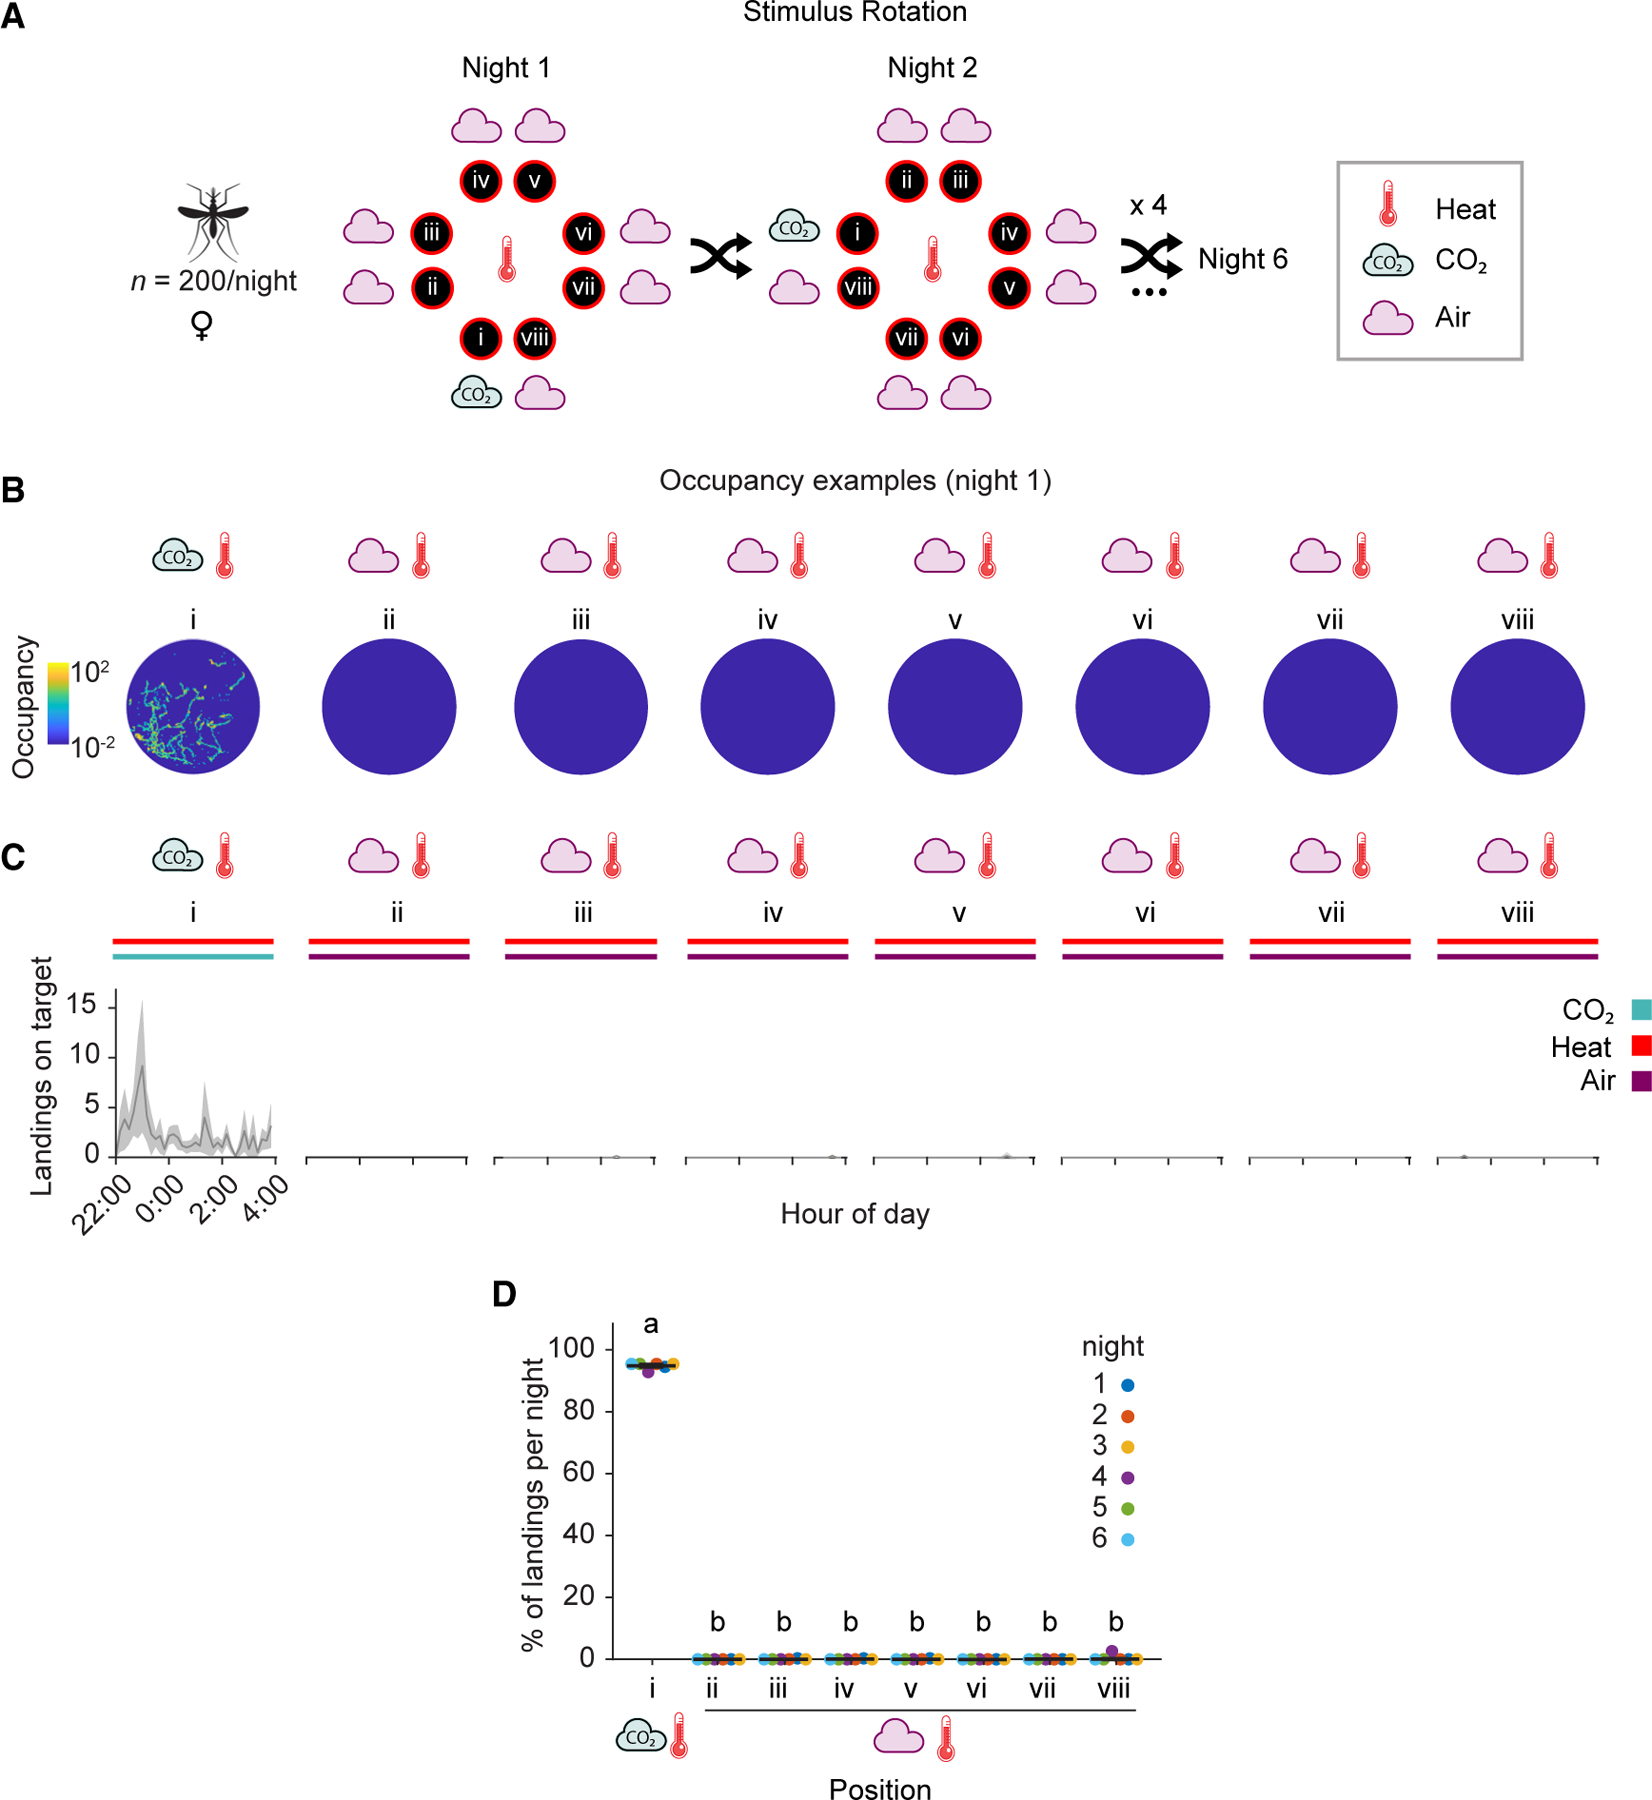
Figure 3. Anopheles gambiae prefers to land on heated targets baited with CO2 emissions reflective of a large human over background air.

(A) Stimulus position and rotation during eight-choice trials with these stimuli. The CO2 stimulus (position i), 400 ppm above atmospheric concentrations to mimic the presence of a large human, was shuffled every night. The background air control positions (ii–viii) were labeled in reference to the CO2 stimulus position in a clockwise manner. All platforms were heated to 35°C throughout the experiment.
(B) Heatmap of platform occupancy for an example night (night 1).
(C) Number of mosquito landings on the OGTA platforms throughout the experiment. Mean ± SEM plotted.
(D) Percentage of the total landings per platform per night. Mean ± SEM plotted. n = 6 trials. The letters indicate significant differences (p < 0.001): observed inter-individual mean landing percentage differences were compared (based on 5,000 permutation resampling simulations) against the null hypothesis assuming these arise only from positional bias, with Benjamini-Hochberg correction.
See also Figures S1, S6, and Data S1B.
