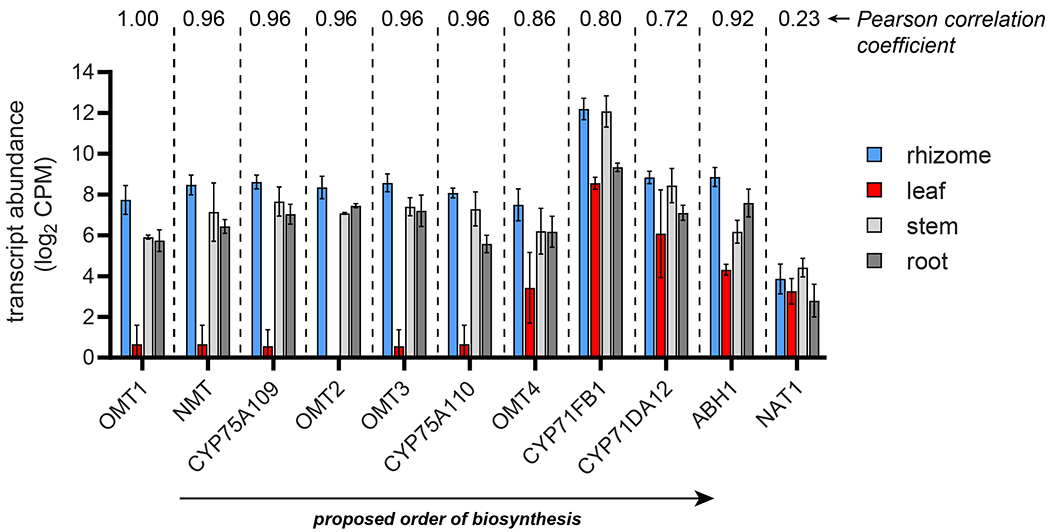
Figure 4. Expression variation of colchicine biosynthetic pathway genes.

Transcript abundances in four sequenced tissues are shown for each biosynthetic pathway gene that acts downstream of 1-phenethylisoquinoline scaffold (2) formation. Shown for each tissue is the trimmed mean of M (TMM)-normalized, log2-transformed transcript counts per million (CPM) with ± standard deviation. n = 5 transcript libraries for rhizome, n = 2 for the three other tissue types. Shown above the bar graphs for each gene is the Pearson correlation coefficient (Pearson’s r) when comparing its transcript expression profile to that of GsOMT1.
