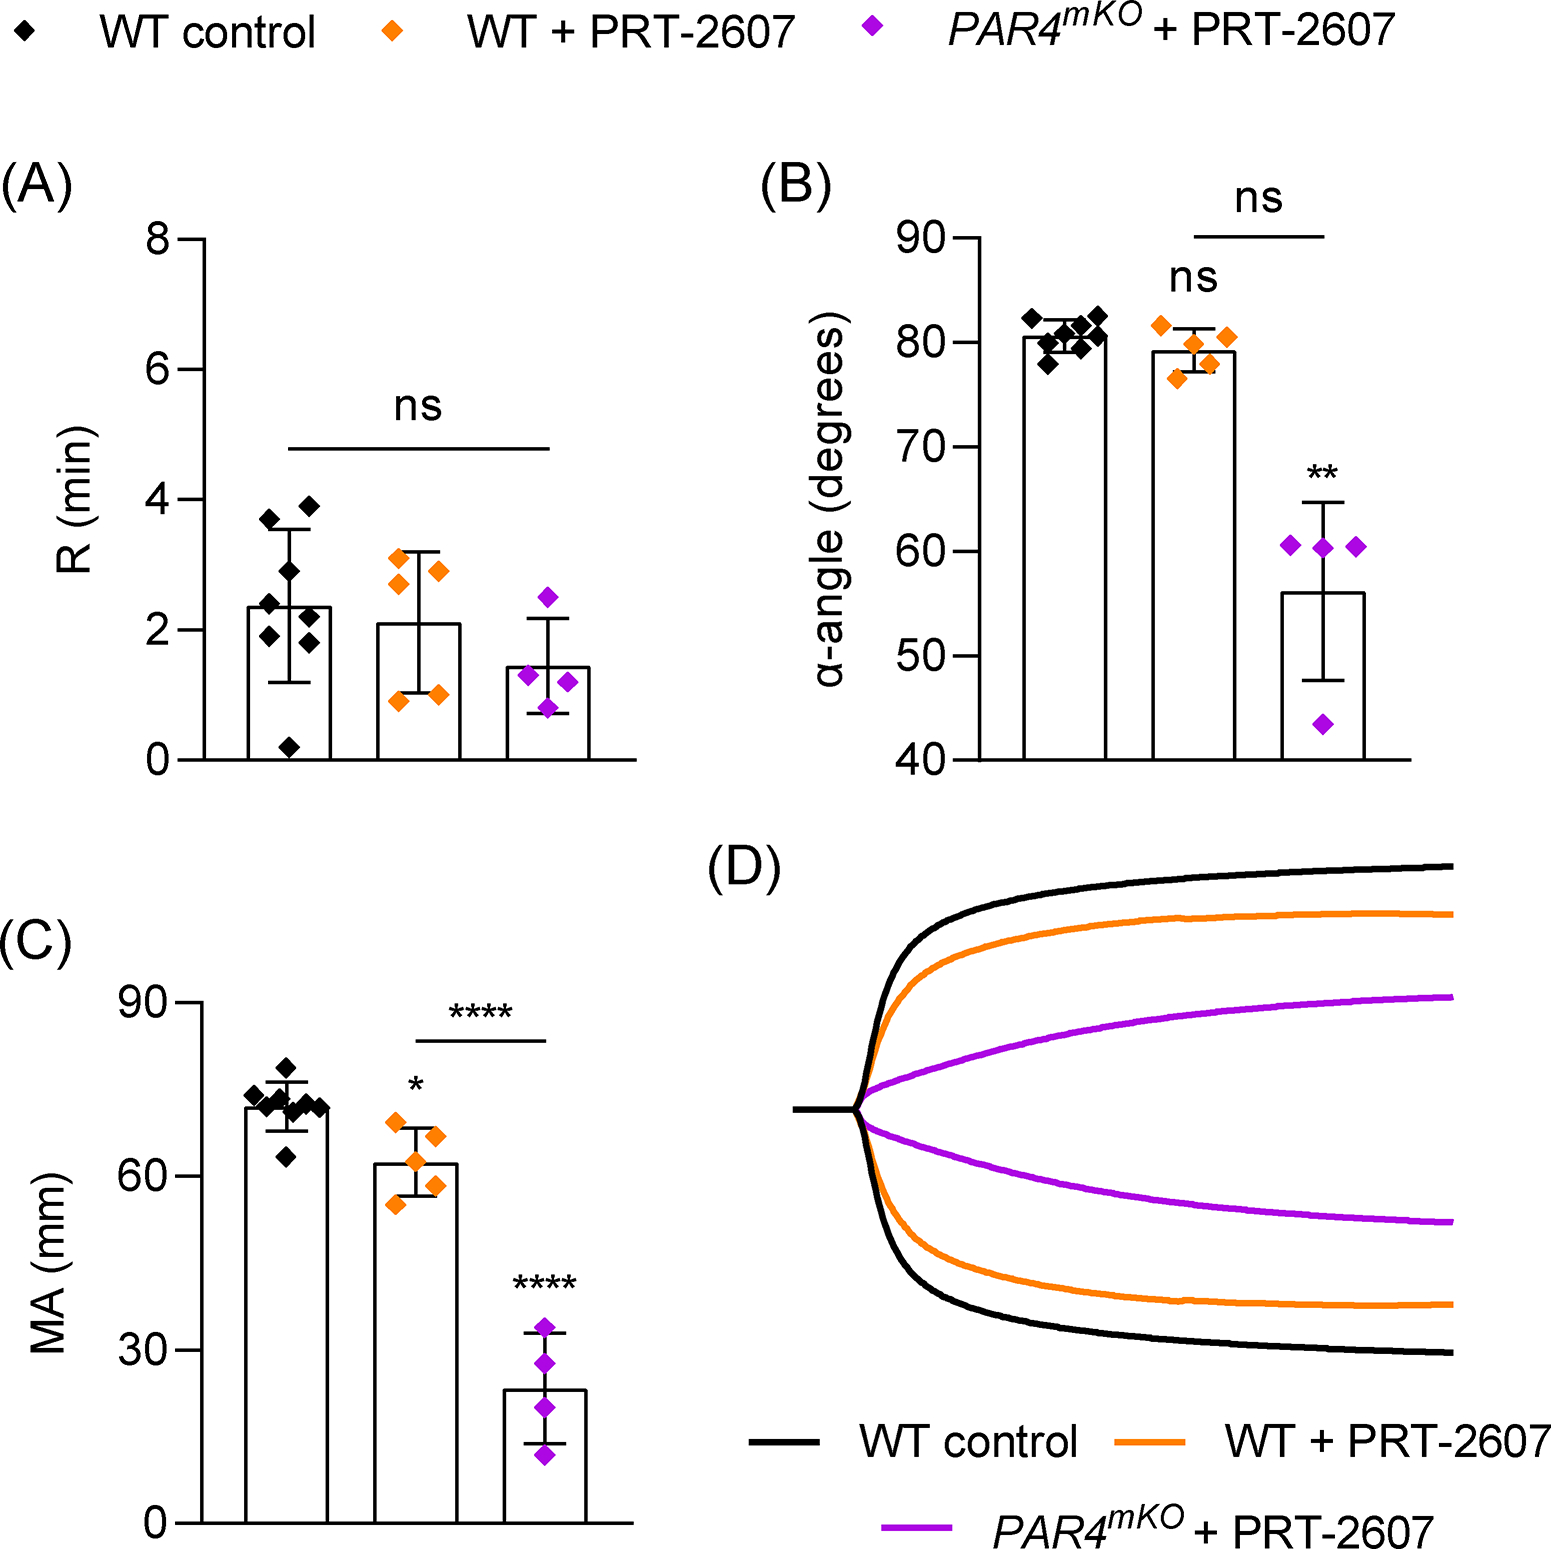
Figure 5:

Role of Syk tyrosine kinase signaling in TEG. Blood samples were analyzed from WT mice (n=8), or WT (n=5) or PAR4mKO (n=4) mice with addition of the Syk inhibitor PRT-2607 (20 μM) 10 mins prior to TEG assay. (A-C) TEG parameters: R time (A), α-angle (B) and MA (C). (D) Representative TEG traces. Data shown as mean ± SD. Statistical significance was determined by one-way ANOVA with Tukey’s multiple comparison test (A,C) or Kruskal-Wallis test with Dunn’s multiple comparison (B). Symbols directly over bars represent significance compared to control. **P < .01, ****P < .0001.
