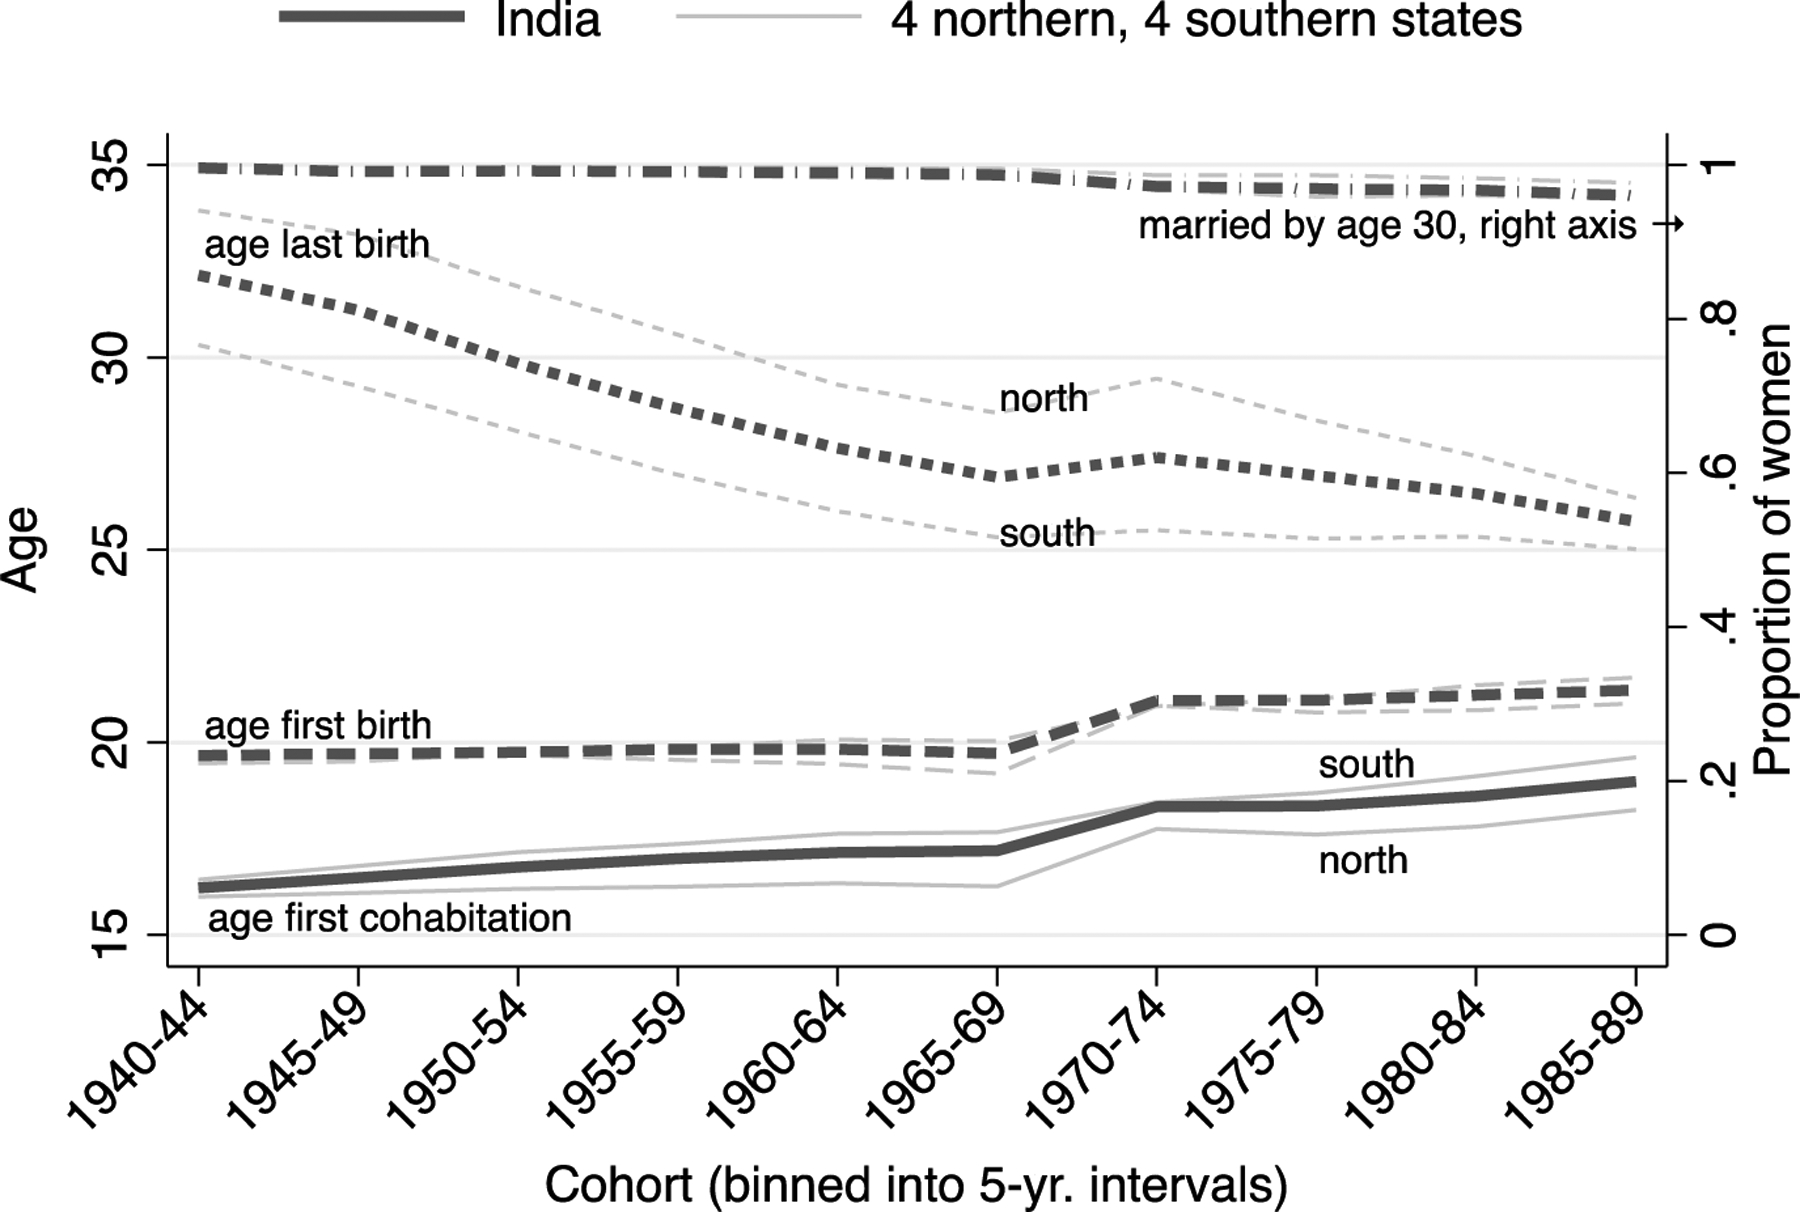
Figure 4: Small increase in age at first birth and large declines in age at last birth across cohorts in India.

Note: Black lines are estimates for India as a whole. Gray lines are estimates for northern and southern states, respectively. The lines for north and south for age at first birth and married by age 30 are not separately labeled because they are so similar to each other. Source: NFHS 1‒5.
